
Fasting insulin (Fasting insulin)
Updated October 31, 2026 · 45 sources · Written by the AumniVIDA team
UnitsWhat is Fasting insulin?
Fasting insulin is the level of insulin in your blood after at least 8 hours without food. It shows how much insulin your pancreas must release to keep overnight glucose normal. Higher values can signal insulin resistance years before glucose rises, but there is no standardized optimal value and assays differ between labs.
Questions people ask about Fasting insulin
- 01Fasting insulin test: why it is done and how to prepareA fasting insulin test is a blood test taken after at least 8 hours without food. Doctors order it to look for insulin resistance, often with fasting glucose to calculate HOMA-IR, or to investigate low blood sugar. It does not diagnose diabetes, and results vary between labs.Read the answer
- 02How to calculate HOMA-IR from fasting insulin and glucoseHOMA-IR equals fasting glucose in mg/dL times fasting insulin in µIU/mL, divided by 405. With glucose in mmol/L, divide by 22.5 instead. For example, 90 mg/dL and 10 µIU/mL give 2.2. Published insulin resistance cut points range from about 1.8 to 3.8 and depend on the assay.Read the answer
- 03What is a good fasting insulin level?Lab normal ranges for fasting insulin are wide, such as 2.6 to 24.9 µIU/mL (16 to 149 pmol/L)16 to 149 pmol/L (2.6 to 24.9 µIU/mL).Read the answer
- 04How to lower fasting insulinWeight loss lowers fasting insulin the most: in one trial it fell about 15% at 5% weight loss and about 48% at 16%.Read the answer
- 05Why is my fasting insulin low?A low fasting insulin with normal glucose usually means your cells are sensitive to insulin, common in lean, active people.Read the answer
Key takeaways
- 1
- 2
- 3
- 4
Combined with glucose as HOMA-IR, it predicted coronary heart disease better than fasting insulin alone [8].
- 5
What is fasting insulin?
Fasting insulin is the amount of insulin in your blood after at least 8 hours without food. Because no meal is driving it, it shows how much insulin your pancreas needs to keep overnight glucose steady, which makes it an early marker of insulin resistance.
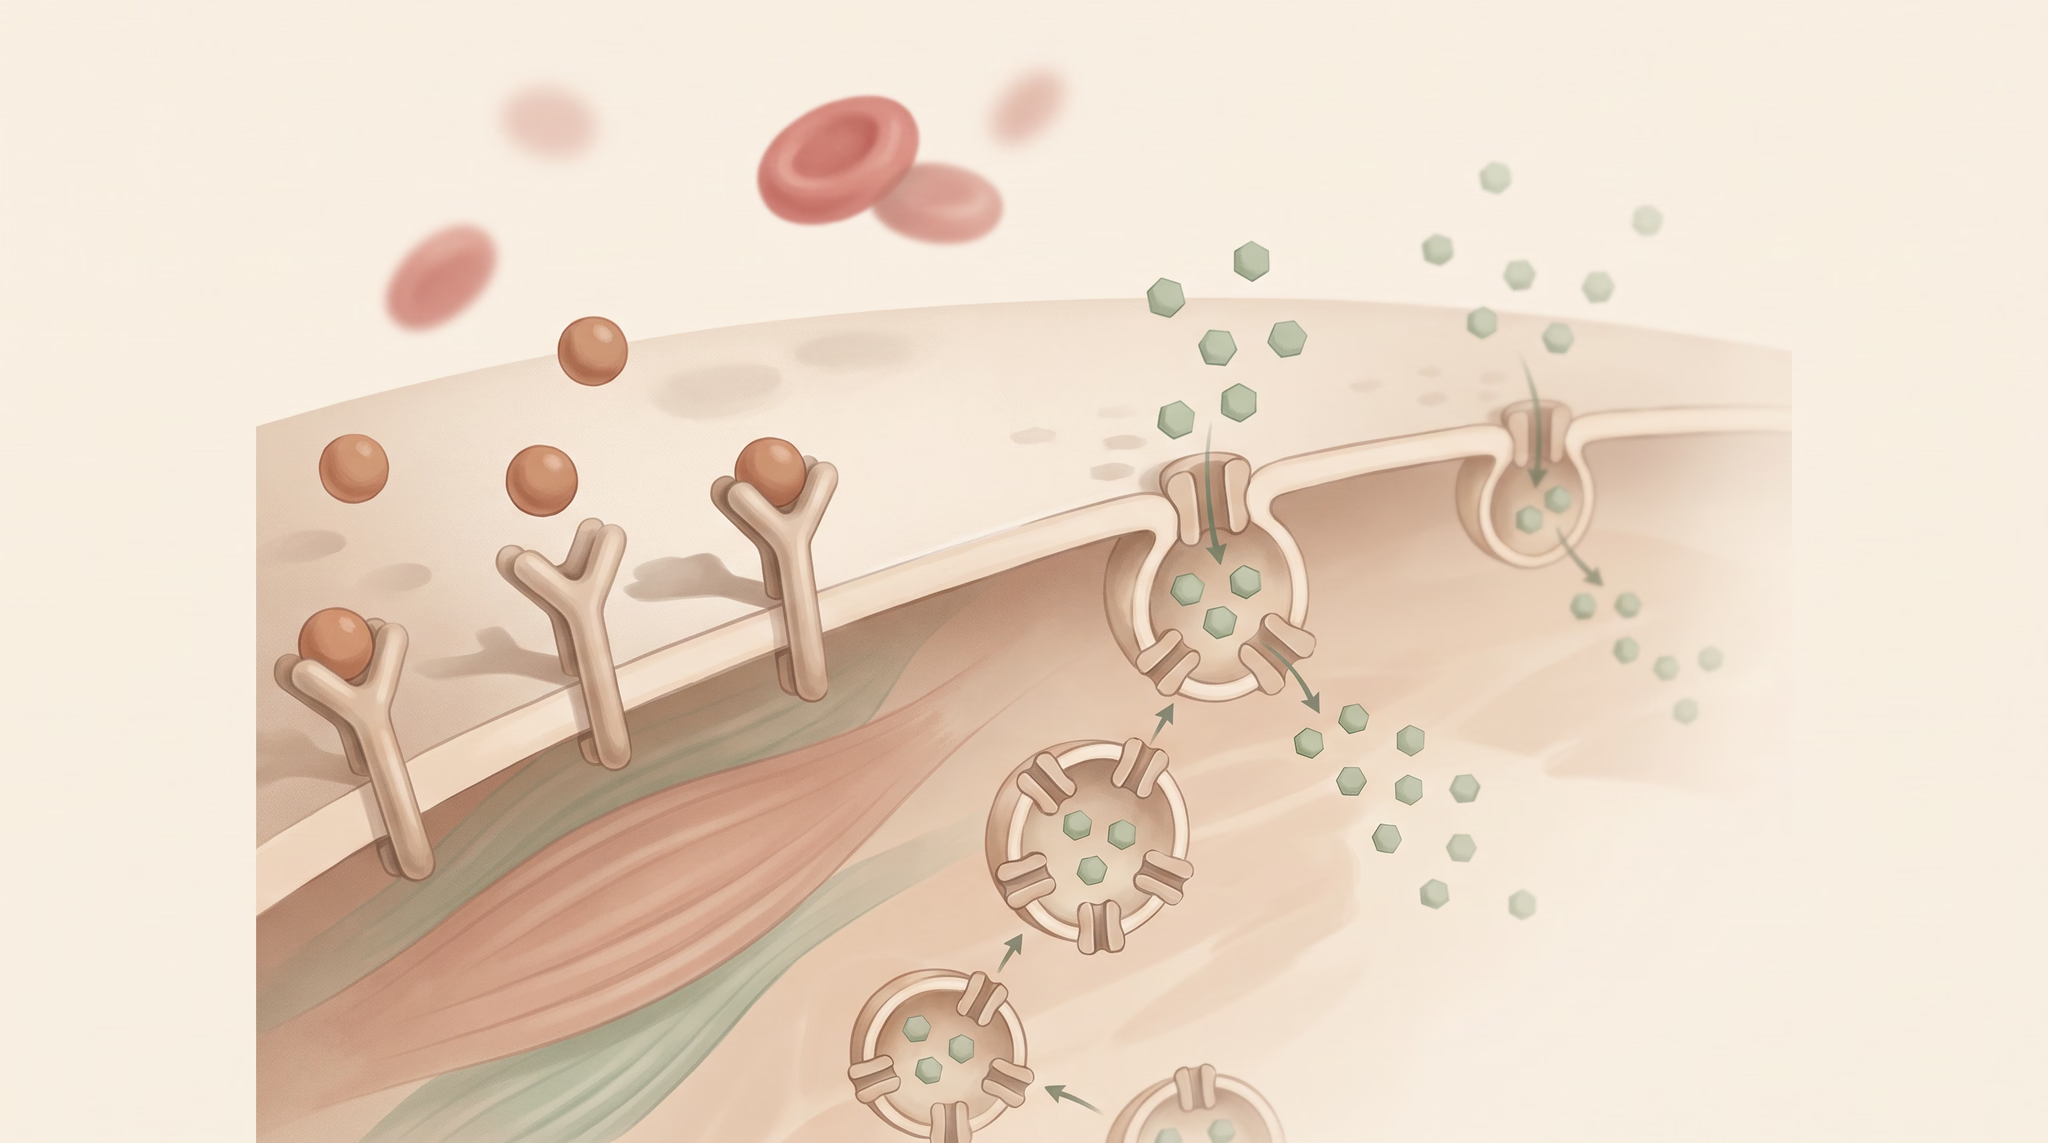
Insulin is the hormone your pancreas releases to move glucose out of the blood and into muscle, fat and liver cells. After a meal it rises sharply. After an overnight fast it settles to a low baseline, and that baseline is what a fasting insulin test measures.
The baseline matters because it reflects demand. If your cells respond well to insulin, a small amount keeps glucose normal. If they respond poorly, the pancreas has to release more to get the same result. That extra output, called compensatory hyperinsulinemia, can keep glucose in the normal range for years [1].
What the test is not: fasting insulin does not diagnose diabetes. The American Diabetes Association diagnoses diabetes and prediabetes from glucose and HbA1c, not insulin [12]. Fasting insulin is a supporting marker that some clinicians order to look for insulin resistance before glucose changes.
Units: most US labs report microinternational units per millilitre (µIU/mL), which is the same as mU/L. Labs that use SI units report pmol/L. The correct conversion for human insulin is 1 µIU/mL = 6.00 pmol/L, but many labs and calculators use 6.945, which shifts results by about 15% [13]. Check which factor your report used before comparing numbers.
Measuring insulin in blood only became possible in 1960, four decades after insulin was discovered [14] [15]. The timeline below shows how slowly the tools for reading it have developed.
From the discovery of insulin to standardizing its measurement
1921
Banting and Best prepare an effective pancreatic extract
1923
Nobel Prize for the discovery of insulin
1960
Yalow and Berson first measure insulin in human plasma
1975
Kraft describes insulin response patterns
1979
Glucose clamp becomes the reference test
1985
HOMA estimates insulin resistance from one fasting sample
1988
Reaven's Banting lecture on insulin resistance
2002
Diabetes Prevention Program trial
2007
ADA workgroup finds insulin assays disagree
2009
Mass spectrometry reference for insulin
2019
Correct conversion factor of 6.00 pmol/L argued
2025
Call to standardize C-peptide
How does insulin resistance raise fasting insulin before glucose?
When muscle, liver and fat cells respond less to insulin, the pancreas compensates by making more. Fasting insulin rises while glucose stays normal. Type 2 diabetes appears only when the beta cells can no longer keep up, often years later.
Insulin is made by beta cells in the islets of the pancreas. It binds receptors on muscle and fat cells, which then move glucose transporters to the cell surface so glucose can enter. In the liver, insulin tells cells to stop releasing stored glucose. Insulin resistance means these signals work less well, so each unit of insulin moves less glucose.
The compensation phase
Gerald Reaven's 1988 Banting lecture set out the model that still frames this field. Insulin resistance is present in most people with impaired glucose tolerance or type 2 diabetes, and in about 25% of nonobese people with normal glucose tolerance. Glucose stays normal only if the beta cell keeps up a state of chronic hyperinsulinemia [1].
Long-term studies show the sequence in real people:
- Pima Indians followed for about 5 years. In 17 people who progressed from normal glucose tolerance to diabetes, insulin action and insulin secretion both fell early. People who stayed healthy also lost insulin sensitivity, but their insulin secretion rose to match [16].
- Whitehall II civil servants. In 505 people who developed diabetes, HOMA insulin sensitivity fell steeply during the 5 years before diagnosis. Fasting glucose rose steeply only in the last 3 years, from 5.79 to 7.40 mmol/L [2].
Which comes first?
Researchers still debate whether excess insulin is only a response to insulin resistance or can also drive it. A 2021 review concluded that both too much insulin secretion and failing insulin secretion matter, at different stages of the path to type 2 diabetes [17].
Kraft patterns
Pathologist Joseph Kraft ran extended oral glucose tolerance tests with insulin measured at each time point and described several insulin response patterns, only one of which he considered normal [18]. Kraft used a 100 g glucose load over 3 to 5 hours, and a delayed insulin peak beyond 60 minutes was linked to poorer health [19]. A later analysis of his database found that just over half of 4,185 people with normal glucose tolerance had hyperinsulinaemia, and that fasting insulin alone had limited value in spotting it [20]. These patterns come from one practice and have not been validated in outcome trials.
Insulin rises years before glucose
- Compensation: insulin rises
- Years beforeInsulin sensitivity starts to fallThe beta cells make more insulin to keep glucose normal.
- 5 years beforeSensitivity falls steeplyHOMA insulin sensitivity dropped steeply in Whitehall II.
- Glucose rises
- 3 years beforeFasting glucose starts to climbFrom 104 to 133 mg/dL (5.79 to 7.40 mmol/L)5.79 to 7.40 mmol/L (104 to 133 mg/dL) over the last 3 years.
- DiagnosisType 2 diabetes is diagnosedThe beta cells can no longer keep up.
A fasting glucose test sees the last 3 years; a fasting insulin test can see the compensation phase. Group averages (Reaven 1988, Weyer 1999, Tabak 2009); individual paths vary.
Why does fasting insulin matter for diabetes and heart disease?
Higher fasting insulin is linked to prediabetes, type 2 diabetes and higher mortality in cohort studies. On its own, though, it predicts heart disease weakly; combined with glucose as HOMA-IR, the link is stronger.
Diabetes risk
In 965 patients tested for suspected prediabetes at a US endocrinology practice, each rise in fasting insulin quartile raised the odds of prediabetes, up to 5 times in the top quartile. A fasting insulin above 9.0 µIU/mL (54 pmol/L)54 pmol/L (9.0 µIU/mL) identified 80% of the people who had prediabetes [4]. That group was mostly white, female and obese, so the cut point may not transfer to other populations.
The Diabetes Prevention Program shows why finding insulin resistance early can matter. In 3,234 adults with raised glucose, a lifestyle program aiming for 7% weight loss and 150 minutes of activity a week cut the incidence of diabetes by 58%, and metformin cut it by 31%, compared with placebo [21].
Heart disease and mortality
A meta-analysis of 65 studies with 516,325 adults without diabetes compared three fasting markers. Per standard deviation increase, the relative risk of coronary heart disease was 1.46 for HOMA-IR, 1.21 for fasting glucose and 1.04 for fasting insulin, which was not statistically significant [8]. In other words, insulin alone was the weakest of the three, and the combination performed best.
A 2026 Canadian cohort of about 8,280 adults found that 36.6% had fasting insulin above 12.5 µIU/mL (75 pmol/L)75 pmol/L (12.5 µIU/mL). After adjusting for age, sex and smoking, people at the 99th percentile of fasting insulin had 3.22 times the mortality of those at the 5th percentile [5].
What this means
Fasting insulin is best read as one signal of how hard your metabolism is working, alongside HbA1c, triglycerides, waist size and blood pressure. Insulin resistance often travels with high triglycerides and low HDL, and with inflammation measured by hs-CRP. Heart risk is still driven mainly by atherogenic particles, measured by ApoB, LDL cholesterol and Lp(a).
How is fasting insulin measured, and why do labs disagree?
Labs measure insulin with immunoassays, and different assays give different numbers for the same blood. An ADA workgroup found results varied by a median of 24% between assays, and a single person's fasting insulin can vary 25% to 50% from sample to sample.
Assays are not standardized
Glucose and HbA1c are measured against shared reference standards. Insulin is not, yet. When an American Diabetes Association workgroup tested commercial insulin assays, the among-assay coefficient of variation ranged from 12% to 66%, with a median of 24%. Only 6 of 10 assays agreed within the 32% total error that biological variability allows [6].
A follow-up compared 10 commercial methods with an isotope dilution mass spectrometry reference method. Seven of the 10 were biased by more than 15.5% in 36% to 100% of individual samples. Calibrating assays to a panel of native serum samples improved agreement the most [22]. The workgroup argued that insulin cannot support clinical decision thresholds until assays are standardized [7].
Biology adds noise
Insulin is released in pulses, so levels can swing within minutes. Single fasting insulin samples can vary by 25% to 50%, and one recommendation is to average three samples taken five minutes apart, which rarely happens in practice [19]. One result is a snapshot; a trend on the same lab is more informative.
Other things that skew the result
- Hemolysis. Labs reject hemolyzed samples for insulin [3].
- Insulin treatment. In people who inject insulin, antibodies to insulin interfere with the assay [3]. The test also cannot separate injected insulin from the body's own.
- Units. The 6.0 versus 6.945 pmol/L conversion changes results by about 15% [13].
C-peptide: the other half of the molecule
The pancreas cuts proinsulin into insulin and C-peptide in equal amounts. C-peptide is the best measure of the body's own insulin output in people with diabetes, because injected insulin does not contain it [23]. Doctors use it mainly to classify diabetes in people treated with insulin [12]. C-peptide assays are not fully standardized either [24].
What is a normal fasting insulin level?
Lab reference ranges for fasting insulin are wide, for example 2.6 to 24.9 µIU/mL (16 to 149 pmol/L)16 to 149 pmol/L (2.6 to 24.9 µIU/mL). Studies have linked values above about 9 to 12.5 µIU/mL with prediabetes or insulin resistance. No universally standardized optimal value exists.
Your lab report will show a reference range. That range describes where most results fall in the lab's reference population, not what is healthy. One large US lab uses 2.6 to 24.9 µIU/mL [3]. Published lab ranges elsewhere run from 5 to 13 µIU/mL to as wide as 3 to 28 µIU/mL [19].
Research thresholds sit much lower in that range. A fasting insulin above 9.0 µIU/mL picked up most prediabetes in one US clinic [4], the 75th percentile in Spanish adults with normal glucose was 12 µIU/mL [25], and a Canadian cohort defined hyperinsulinemia as above 75 pmol/L, about 12.5 µIU/mL [5].
The table compiles thresholds from different countries and methods in one place. Notice how much they differ. HOMA-IR cut points alone range from about 1.8 in Iran to 3.8 in Mexican Americans [26] [27]. Part of that spread is population, and part is that each study used a different insulin assay [6].
About "optimal" numbers: some clinicians promote fasting insulin targets well below lab upper limits. Lower values within the normal range are generally linked to better insulin sensitivity, but no guideline body has validated a specific optimal value, and the assay problem means a target from one lab may not apply to another. For details on reading a single result, see what is a good fasting insulin level.
| Source | Population | Fasting insulin | HOMA-IR | What it marks |
|---|---|---|---|---|
| Labcorp reference range | US commercial lab | 2.6 to 24.9 µIU/mL (16 to 149 pmol/L)16 to 149 pmol/L (2.6 to 24.9 µIU/mL) | Not reported | Lab reference range |
| Johnson 2010 | 965 US patients tested for prediabetes | Above 9.0 µIU/mL (54 pmol/L)54 pmol/L (9.0 µIU/mL) | Not used as cut point | Identified 80% with prediabetes |
| Ascaso 2003 | 65 Spanish adults, normal glucose | 12 µIU/mL (72 pmol/L)72 pmol/L (12 µIU/mL) | 2.6 | 75th percentile |
| Wiebe 2026 | About 8,280 Canadian adults | Above 12.5 µIU/mL (75 pmol/L)75 pmol/L (12.5 µIU/mL) | Not used | Hyperinsulinemia definition, 36.6% above |
| Yamada 2011 | 2,153 healthy Japanese adults | Not reported | 0.4 to 2.4; 2.5 or higher flags IR | Reference interval |
| Esteghamati 2010 | 3,071 Iranian adults without diabetes | Not reported | 1.775 | Best cut point for metabolic syndrome |
| Gayoso-Diz 2013 | 2,459 Spanish adults | Not reported | 2.05 (1.85 in men without diabetes); 3.46 at 90th percentile | Metabolic syndrome cut point |
| Qu 2011 | 1,854 Mexican American adults | Not reported | 3.80 | Insulin resistance by clustering |
| Tam 2012 | US adults with clamp studies | Not reported | Above 5.9, or 2.8 to 5.9 with HDL below 51 mg/dL | Clamp-defined insulin resistance |
Reported fasting insulin reference limits and research thresholds
- Below one lab's reference range
- 00 to 2.616
- Within lab range, below research thresholds
- 2.616 to 954
- Thresholds studies have linked to prediabetes or insulin resistance
- 954 to 12.575
- Within lab range, above research thresholds
- 12.575 to 24.9149
- Above one lab's reference range
- 24.9149 to 30180
- 2.6 µIU/mL (multiply by 6.0 for pmol/L)16 pmol/L: Labcorp lower limit
- 9 µIU/mL (multiply by 6.0 for pmol/L)54 pmol/L: Above 9 caught 80% of prediabetes (US clinic)
- 12 µIU/mL (multiply by 6.0 for pmol/L)72 pmol/L: 75th percentile, normal glucose (Spain)
- 12.5 µIU/mL (multiply by 6.0 for pmol/L)75 pmol/L: Hyperinsulinemia cut point, 75 pmol/L (Canada)
- 24.9 µIU/mL (multiply by 6.0 for pmol/L)149 pmol/L: Labcorp upper limit
Fasting insulin vs fasting glucose vs HbA1c: what does each show?
Fasting glucose and HbA1c show whether blood sugar is already high and are used to diagnose diabetes. Fasting insulin shows how hard the pancreas is working to keep glucose normal, so it can change earlier, but it is less standardized.
These markers answer different questions. HbA1c and fasting glucose tell you whether glucose control has already slipped. Fasting insulin tells you how much effort it takes to hold glucose where it is.
That is why a person can have a normal fasting glucose of 90 mg/dL and a high fasting insulin: the pancreas is compensating [1]. Combining the two as HOMA-IR captures both sides and predicted coronary heart disease better than either alone in a large meta-analysis [8]. See how to calculate HOMA-IR.
For diagnosis and treatment decisions, guidelines rely on glucose and HbA1c because they are standardized and tied to outcomes [12]. Fasting insulin is best used as an early context marker, ideally repeated on the same lab.
| Fasting insulin | Fasting glucose | HbA1c | |
|---|---|---|---|
| What it measures | Insulin output needed overnight | Blood sugar after 8 hours fasting | Average blood sugar over the past 2 to 3 months |
| Used to diagnose diabetes | No | Yes: 126 mg/dL (7.0 mmol/L)7.0 mmol/L (126 mg/dL) or higher | Yes: 6.5% (48 mmol/mol)48 mmol/mol (6.5%) or higher |
| Prediabetes range | No agreed range | 100 to 125 mg/dL (5.6 to 6.9 mmol/L)5.6 to 6.9 mmol/L (100 to 125 mg/dL) | 5.7% to 6.4% (39 to 47 mmol/mol)39 to 47 mmol/mol (6.4%) |
| When it changes | Early, during compensation | Late; steep rise in the last 3 years before diabetes | Late, alongside glucose |
| Assay standardized | No | Yes | Yes, NGSP certified |
| Coronary risk per SD (no diabetes) | 1.04, not significant | 1.21 | Not in that analysis |
What lowers or raises fasting insulin?
Weight loss lowers fasting insulin the most and in proportion to the amount lost. Exercise and low-carbohydrate eating each lower it by about 2 to 3 µIU/mL on average. Short sleep raises insulin resistance. Fasting insulin also falls when you fast.
The chart compiles average effects from trials and meta-analyses. They come from different populations and comparisons, so treat them as rough sizes.
- Weight loss. In adults with obesity, basal insulin fell from 18.3 to 15.5 mU/L at 5% weight loss, 12.6 at 11% and 9.5 at 16% [9].
- Exercise. Across 86 trials in adults with overweight or obesity, every exercise type lowered fasting insulin; high-intensity interval training ranked first at 2.24 µU/mL [10]. See the Zone 2 training protocol.
- Carbohydrate. Low-carbohydrate diets lowered fasting insulin by 15.35 pmol/L, about 2.6 µIU/mL [11], and ketogenic diets lowered insulin 3.15 µU/mL more than Mediterranean diets in head-to-head trials [28]. See keto and low-carb and glucose stability.
- Meal timing. Time-restricted eating had a small effect on HOMA-IR and an inconclusive effect on fasting insulin [29]. See time-restricted eating.
- Sleep. Sleep restriction reduces insulin sensitivity in randomized trials [30].
- Medication. Metformin lowered HOMA-IR by 0.50 versus placebo in adults with PCOS [31]. Medication decisions belong with your clinician.
Things that raise a single reading include a recent meal, a hemolyzed sample or a different assay [3] [6]. Ranked levers and practical detail are on how to lower fasting insulin.
How much each lever lowered fasting insulin in trials
- 16% weight loss8.8 µIU/mL lower fasting insulin (average)53 pmol/L lower fasting insulin (average)
Within-group change, 9 adults with obesity (Magkos 2016)
- 11% weight loss5.7 µIU/mL lower fasting insulin (average)34 pmol/L lower fasting insulin (average)
Within-group change, same 9 adults (Magkos 2016)
- Ketogenic vs Mediterranean diet3.15 µIU/mL lower fasting insulin (average)19 pmol/L lower fasting insulin (average)
Head-to-head trials (Kun 2026)
- 5% weight loss2.8 µIU/mL lower fasting insulin (average)17 pmol/L lower fasting insulin (average)
Within-group change, same 9 adults (Magkos 2016)
- Low-carbohydrate diets2.56 µIU/mL lower fasting insulin (average)15 pmol/L lower fasting insulin (average)
Umbrella review, converted from 15.35 pmol/L at 6.0 (Chatzi 2024)
- High-intensity interval training2.24 µIU/mL lower fasting insulin (average)13 pmol/L lower fasting insulin (average)
Versus usual care, 86 trials (Jiao 2026)
Show the data
| Item | Value (µIU/mL lower fasting insulin (average)) | Low | High | Note |
|---|---|---|---|---|
| 16% weight loss | 8.8 | Within-group change, 9 adults with obesity (Magkos 2016) | ||
| 11% weight loss | 5.7 | Within-group change, same 9 adults (Magkos 2016) | ||
| Ketogenic vs Mediterranean diet | 3.15 | 1.28 | 5.02 | Head-to-head trials (Kun 2026) |
| 5% weight loss | 2.8 | Within-group change, same 9 adults (Magkos 2016) | ||
| Low-carbohydrate diets | 2.56 | 1.85 | 3.26 | Umbrella review, converted from 15.35 pmol/L at 6.0 (Chatzi 2024) |
| High-intensity interval training | 2.24 | Versus usual care, 86 trials (Jiao 2026) |
What does the evidence not show?
No trial shows that lowering fasting insulin itself prevents heart attacks or death. No standardized optimal value exists, and cut points from one assay or population do not transfer cleanly to another.
- No treat-to-target evidence. Trials such as the Diabetes Prevention Program show that lifestyle change and metformin prevent diabetes [21], but no trial has tested lowering fasting insulin to a target and measured heart attacks or deaths.
- No standardized optimal value. Assays still disagree [6] [22], and population cut points span a wide range [26] [27] [32]. The insulin standardization workgroup itself said assays must be harmonized before insulin can guide routine care [7].
- Fasting insulin alone predicts heart disease weakly. In the largest meta-analysis it was not significantly linked to coronary heart disease per standard deviation, while HOMA-IR was [8].
- Causation is unsettled. Whether excess insulin drives disease or mostly marks insulin resistance is still debated [17]. Cohort links such as higher mortality with very high insulin [5] do not prove cause.
- Lower is not always better. In lean Japanese adults, the lowest HOMA-IR groups also had higher mortality, a J-shaped pattern [33]. Very low insulin with high glucose can signal failing insulin production. See why fasting insulin can be low.
- Dynamic tests are not validated for screening. Kraft-style insulin curves can reveal hyperinsulinaemia that fasting insulin misses [20], but they have not been tested against outcomes.
The research
Foundational studies
The work that established what this marker means.
- 1960Immunoassay of endogenous plasma insulin in manJournal of Clinical InvestigationDescribed the radioimmunoassay that first made it possible to measure the body's own insulin in plasma.
- 1975Detection of diabetes mellitus in situ (occult diabetes)Laboratory MedicineReported insulin response patterns during extended oral glucose tolerance tests and proposed that abnormal insulin patterns can reveal metabolic disease while glucose is still normal.
- 1979Glucose clamp technique: a method for quantifying insulin secretion and resistanceAmerican Journal of PhysiologyDescribed the glucose clamp, which remains the reference method for measuring insulin sensitivity and secretion.
- 1985Homeostasis model assessment: insulin resistance and beta-cell function from fasting plasma glucose and insulin concentrations in manDiabetologiaIntroduced HOMA, which estimates insulin resistance from one fasting glucose and insulin pair; the estimate correlated with the euglycaemic clamp (Rs 0.88) but had a coefficient of variation of 31%.
- 1988Banting lecture 1988. Role of insulin resistance in human diseaseDiabetesArgued that insulin resistance is present in about 25% of nonobese people with normal glucose tolerance, and that the beta cell holds glucose normal only by maintaining chronic hyperinsulinemia, which carries its own risks.
- 1998Correct homeostasis model assessment (HOMA) evaluation uses the computer programDiabetes CareThe HOMA developers stated that the updated computer model, not the simple 1985 approximation formula, gives the correct HOMA estimate.
- 1999The natural history of insulin secretory dysfunction and insulin resistance in the pathogenesis of type 2 diabetes mellitusJournal of Clinical InvestigationFollowed 17 Pima Indians from normal glucose tolerance to diabetes over about 5 years and found that falling insulin action and falling insulin secretion both appear early; people who stayed normal raised their insulin secretion as sensitivity declined.
- 2000Homeostasis model assessment closely mirrors the glucose clamp technique in the assessment of insulin sensitivity: studies in subjects with various degrees of glucose tolerance and insulin sensitivityDiabetes CareIn 115 people, HOMA correlated strongly with clamp-measured glucose disposal (r = -0.82) and was judged reliable for large studies with only a fasting sample.
- 2009Trajectories of glycaemia, insulin sensitivity, and insulin secretion before diagnosis of type 2 diabetes: an analysis from the Whitehall II studyLancetIn 505 people who developed type 2 diabetes, HOMA insulin sensitivity fell steeply in the 5 years before diagnosis, while fasting glucose rose steeply only in the last 3 years.
Guidelines and reviews
Where expert bodies and systematic reviews have landed.
- 2004Use and abuse of HOMA modelingDiabetes CareThe HOMA developers reviewed its use and warned that HOMA depends on robust input data and careful interpretation.
- 2007Standardization of insulin immunoassays: report of the American Diabetes Association WorkgroupClinical ChemistryAn American Diabetes Association workgroup tested commercial insulin assays and found among-assay coefficients of variation from 12% to 66% (median 24%); only 6 of 10 assays agreed within the allowable 32% total error.
- 2009Toward standardization of insulin immunoassaysClinical ChemistryCompared 10 commercial insulin methods with an isotope dilution mass spectrometry reference; 7 of 10 were biased by more than 15.5% in many samples, and calibration to a panel of native sera improved agreement.
- 2009Evaluation and management of adult hypoglycemic disorders: an Endocrine Society Clinical Practice GuidelineJournal of Clinical Endocrinology and MetabolismRecommends measuring glucose, insulin, C-peptide, proinsulin and related markers during a documented episode of low blood sugar when endogenous hyperinsulinism is suspected.
- 2010Insulin assay standardization: leading to measures of insulin sensitivity and secretion for practical clinical careDiabetes CareThe insulin standardization workgroup argued that assays must be standardized before insulin-based measures of sensitivity and secretion can guide routine clinical care.
- 2012Insulin resistance and risk of incident cardiovascular events in adults without diabetes: meta-analysisPLoS OneAcross 65 studies and 516,325 people, coronary heart disease risk per standard deviation was 1.46 for HOMA-IR, 1.21 for fasting glucose and 1.04 (not significant) for fasting insulin alone.
- 2013The clinical utility of C-peptide measurement in the care of patients with diabetesDiabetic MedicineExplained that C-peptide is released in equal amounts to insulin and is the best measure of the body's own insulin secretion in people with diabetes.
- 2015Hyperinsulinemia: A unifying theory of chronic disease?DiabesityReviewed hyperinsulinemia testing and noted that single fasting insulin samples vary by 25% to 50%, that lab reference ranges differ widely and that no standardized reference range exists.
- 2019Insulin Units and Conversion Factors: A Story of Truth, Boots, and Faster Half-TruthsJournal of Diabetes Science and TechnologyShowed that the correct factor for human insulin is 1 µIU/mL = 6.00 pmol/L, while the widely used 6.945 factor misstates concentrations by about 15%.
- 2020Management of Latent Autoimmune Diabetes in Adults: A Consensus Statement From an International Expert PanelDiabetesEstimated that LADA makes up 2% to 12% of adult-onset diabetes and used random C-peptide bands (below 0.3, 0.3 to 0.7 and above 0.7 nmol/L) to guide treatment.
- 2021On the causal relationships between hyperinsulinaemia, insulin resistance, obesity and dysglycaemia in type 2 diabetesDiabetologiaReviewed evidence on whether excess insulin secretion or failing insulin secretion comes first and concluded both beta cell defects matter, at different stages.
- 2022Effects of sleep manipulation on markers of insulin sensitivity: A systematic review and meta-analysis of randomized controlled trialsSleep Medicine ReviewsPooled randomized trials showed that sleep restriction reduces insulin sensitivity, including when measured by HOMA-IR, and that circadian misalignment also harms it.
- 2023The impact of metformin with or without lifestyle modification versus placebo on polycystic ovary syndrome: a systematic review and meta-analysis of randomized controlled trialsEuropean Journal of EndocrinologyIn adults with PCOS, metformin lowered HOMA-IR by 0.50 more than placebo (95% CI 0.09 to 0.91), with more mild gastrointestinal side effects.
- 2024Effect of Different Dietary Patterns on Cardiometabolic Risk Factors: An Umbrella Review of Systematic Reviews and Meta-AnalysesNutrientsAcross 25 meta-analyses in adults with cardiometabolic risk factors, low-carbohydrate diets showed strong evidence of lowering fasting insulin by 15.35 pmol/L (95% CI 11.12 to 19.58).
- 2024Effects of Intermittent Energy Restriction Compared with Those of Continuous Energy Restriction on Body Composition and Cardiometabolic Risk Markers - A Systematic Review and Meta-Analysis of Randomized Controlled Trials in AdultsAdvances in NutritionIn 28 trials, intermittent energy restriction (time-restricted eating, alternate-day fasting, 5:2) did not lower insulin or HOMA-IR more than ordinary daily calorie restriction overall.
- 20262. Diagnosis and Classification of Diabetes: Standards of Care in Diabetes-2026Diabetes CareDiagnoses diabetes and prediabetes with glucose and HbA1c thresholds, not insulin; defines fasting as no caloric intake for at least 8 hours; reserves C-peptide testing mainly for people treated with insulin.
Recent research
Notable work from the last three years.
- 2025Call for Standardization of C-Peptide MeasurementJournal of Diabetes Science and TechnologyNoted that ADA and EASD now use C-peptide below 0.2 nmol/L to suggest type 1 and above 0.6 nmol/L to suggest type 2 diabetes, but C-peptide assays are still not standardized.
- 2025Excessively Low Insulin Resistance May Increase the Risk of All-Cause Mortality Among Community-Dwelling Individuals Without DiabetesCureusIn 2,040 Japanese adults without diabetes, BMI changed the HOMA-IR and mortality link: in lean people (BMI below 22) the lowest HOMA-IR groups also had higher mortality, a J-shaped curve.
- 2026Exercise and Insulin-Resistance Biomarkers in Adults With Overweight/Obesity: A Network Meta-Analysis of Randomised Controlled TrialsDiabetes, Obesity and MetabolismAcross 86 trials in 4,358 adults with overweight or obesity, every exercise type lowered fasting insulin and HOMA-IR; HIIT ranked first (fasting insulin -2.24 µU/mL, HOMA-IR -0.67), with low to moderate certainty.
- 2026Comparative effects of ketogenic diets and mediterranean diets on obesity and metabolic outcomes: a systematic review and meta-analysisReviews in Endocrine and Metabolic DisordersIn head-to-head trials, ketogenic diets lowered insulin 3.15 µU/mL more than Mediterranean diets (95% CI 1.28 to 5.02), with no difference in fasting glucose or HbA1c.
- 2026The Effect of Time-Restricted Eating on Metabolic Risk Factors for Cardiovascular Disease and Non-Alcoholic Fatty Liver Disease in Overweight and Obese Adults: A Systematic Review and Meta-AnalysisNutrition ReviewsAcross 28 trials in 1,648 adults, time-restricted eating had a small effect on HOMA-IR (effect size -0.29) and an inconclusive effect on fasting insulin.
- 2026Effects of Time-Restricted Eating Combined with Exercise on Body Composition and Cardiometabolic Health in Adults with Overweight or Obesity: A Systematic Review and Meta-AnalysisNutrition ReviewsIn 11 trials, adding time-restricted eating to exercise lowered HOMA-IR by 0.44 more than exercise with a usual diet, without a significant difference in fasting insulin overall.
- 2026Age-Specific Analysis of the Effects of Intermittent Fasting on Body Composition and Cardiometabolic Markers in Healthy Adults and Individuals with Overweight or Obesity: A Systematic Review and Meta-Analysis of Randomized Controlled TrialsNutrientsIn 28 trials, intermittent fasting lowered fasting insulin and HOMA-IR significantly in adults under 30, with low to very low certainty and some loss of lean mass.
- 2026Associations of obesity, systemic inflammation, and hyperinsulinemia with the incidence of non-communicable chronic disease and mortality: A prospective cohort studyDiabetes, Obesity and MetabolismIn about 8,280 Canadian adults, 36.6% had fasting insulin above 75 pmol/L, and insulin at the 99th percentile was linked to 3.22 times the mortality of the 5th percentile after adjustment.
What well-known voices say about Fasting insulin
Their positions, summarized in our words. Follow each link for the full context.
Gerald ReavenEndocrinologist and insulin resistance researcher; gave the 1988 Banting Lecture
Reaven argued that insulin resistance, not only high glucose, drives disease. In his view the pancreas protects glucose by keeping insulin chronically high, and that compensation has its own costs, including links to high blood pressure. Mainstream guidelines adopted the concept of insulin resistance but still diagnose diabetes by glucose and HbA1c.
Banting lecture 1988: Role of insulin resistance in human disease (Diabetes)
Catherine CroftsHyperinsulinemia researcher, Auckland University of Technology
Crofts argues that high insulin often appears while glucose tolerance is still normal and may be the earliest sign of metabolic disease. She sees limited value in a single fasting insulin and favours dynamic insulin patterns after a glucose load, building on Joseph Kraft's database. She acknowledges that these patterns still need outcome research before routine screening.
James D. JohnsonDiabetes researcher, University of British Columbia
Johnson questions the standard view that high insulin is only a response to insulin resistance. He reviews evidence that excess insulin secretion can come early and contribute to obesity and insulin resistance, while agreeing that failing insulin secretion matters later. He frames this as an open debate rather than settled science.
David MatthewsDiabetes physician at Oxford and co-developer of HOMA
Matthews and colleagues, who created HOMA, see it as a valuable clinical and research tool when used properly. They caution that it depends on robust insulin and glucose measurements and careful interpretation, and they recommend the updated computer model over the simple formula. Their original paper noted that its low precision limits use in one person.
Watch
Talks and explainers worth your time. Nothing loads from YouTube until you press play.
Mayo Clinic Explains Insulin Resistance
Mayo ClinicMayo Clinic@mayoclinicSubscribers1.3MStartedJune 2006CountryUnited StatesVideos12.6KTotal views501.8MNew videos, last 30 days61New videos, last year500+From YouTube, 2026-10-31Open on YouTube
A Mayo Clinic endocrinologist explains what insulin resistance is, who gets it and how it is diagnosed and treated.
Explaining Insulin Resistance
Cleveland ClinicCleveland Clinic@clevelandclinicSubscribers761KStartedFebruary 2007CountryUnited StatesVideos6.6KTotal views396.5MNew videos, last 30 days64New videos, last year500+From YouTube, 2026-10-31Open on YouTube
A short, plain explanation of how insulin resistance leads to high blood sugar, prediabetes and type 2 diabetes.
What is insulin resistance? Why does it happen? [Dr. Christopher Gardner]
Stanford Center for Health EducationStanford Center for Health Education@stanford_cheSubscribers131KStartedFebruary 2017CountryUnited StatesVideos929Total views37.2MNew videos, last 30 days0New videos, last year35From YouTube, 2026-10-31Open on YouTube
A Stanford nutrition scientist explains the causes of insulin resistance and the role of diet.
337- Insulin resistance masterclass: The full body impact of metabolic dysfunction, treatment & more
Peter Attia MDPeter Attia MD@peterattiamdSubscribers1MStartedJuly 2015CountryNot statedVideos1.8KTotal views137.4MNew videos, last 30 days7New videos, last year105From YouTube, 2026-10-31Open on YouTube
Ralph DeFronzo, who developed the glucose clamp, discusses how insulin resistance is measured and treated in depth.
Fasting Insulin Levels Explained: Why It Matters | Dr. Robert Lustig
Levels | Health, Metabolism & Human PerformanceLevels | Health, Metabolism & Human Performance@levelsSubscribers329KStartedJune 2020CountryUnited StatesVideos1KTotal views53.4MNew videos, last 30 days21New videos, last year196From YouTube, 2026-10-31Open on YouTube
Endocrinologist Robert Lustig makes the case for fasting insulin as a metabolic health marker; weigh it against the assay caveats on this page.
40: How to Measure and Fix Insulin Resistance with Dr. Ben Bikman
Ben BikmanBen Bikman@benbikmanSubscribers232KStartedAugust 2016CountryUnited StatesVideos190Total views12.2MNew videos, last 30 days4New videos, last year46From YouTube, 2026-10-31Open on YouTube
Physiologist Ben Bikman walks through ways to assess insulin resistance beyond glucose, from an advocate's point of view.
Protocols that act on Fasting insulin
- Low-glycemic dietA low-glycemic diet favors carbohydrate foods that raise blood sugar slowly, rated by the glycemic index (GI): 55 or less is low and 70 or more is high.
- Time-restricted eatingTime-restricted eating means eating all of the day's food and caloric drinks within a consistent daily window, usually 6 to 10 hours, and fasting the rest of the day.
- Ketogenic dietA ketogenic diet keeps carbohydrate under about 20 to 50 g a day so the body burns fat and makes ketones, defined in supervised programs as blood BHB of 0.5 to 3.0 mmol/L.
- Zone 2 cardioZone 2 cardio is steady aerobic exercise held just below the first lactate threshold, where blood lactate stays near 2 mmol/L and you can still talk in full sentences.
Common questions
What does fasting insulin tell you?
Does fasting affect insulin levels?
Yes. Insulin falls when you have not eaten, which is why the test requires at least 8 hours of fasting [12]. A recent meal raises it sharply.
Fasting insulin vs fasting glucose: which is better?
Fasting insulin vs A1c: what is the difference?
What are the units of fasting insulin?
µIU/mL, which equals mU/L, or pmol/L. Multiply µIU/mL by 6.00 to get pmol/L; some labs use 6.945 [13].
What are the symptoms of high fasting insulin?
High fasting insulin itself usually causes no symptoms. It often travels with signs of insulin resistance, such as severe obesity or dark velvety skin patches called acanthosis nigricans, which the ADA lists as conditions associated with insulin resistance [12].
What causes high fasting insulin?
Is fasting insulin and C-peptide the same test?
No. C-peptide is released in equal amounts with insulin and measures the body's own output even in people who inject insulin [23].
Sources
- 1.Reaven GM. Banting lecture 1988. Role of insulin resistance in human disease. Diabetes, 1988. doi:10.2337/diab.37.12.1595
- 2.Tabák AG, Jokela M, Akbaraly TN, et al. Trajectories of glycaemia, insulin sensitivity, and insulin secretion before diagnosis of type 2 diabetes: an analysis from the Whitehall II study. Lancet, 2009. doi:10.1016/S0140-6736(09)60619-X
- 3.Labcorp. Insulin (test 004333). Labcorp test menu, 2026. Link
- 4.Johnson JL, Duick DS, Chui MA, Aldasouqi SA. Identifying prediabetes using fasting insulin levels. Endocrine Practice, 2010. doi:10.4158/EP09031.OR
- 5.Wiebe N, Thompson S, Stenvinkel P, et al. Associations of obesity, systemic inflammation, and hyperinsulinemia with the incidence of non-communicable chronic disease and mortality: A prospective cohort study. Diabetes, Obesity and Metabolism, 2026. doi:10.1111/dom.70568
- 6.Marcovina S, Bowsher RR, Miller WG, et al. Standardization of insulin immunoassays: report of the American Diabetes Association Workgroup. Clinical Chemistry, 2007. doi:10.1373/clinchem.2006.082214
- 7.Staten MA, Stern MP, Miller WG, et al. Insulin assay standardization: leading to measures of insulin sensitivity and secretion for practical clinical care. Diabetes Care, 2010. doi:10.2337/dc09-1206
- 8.Gast KB, Tjeerdema N, Stijnen T, Smit JW, Dekkers OM. Insulin resistance and risk of incident cardiovascular events in adults without diabetes: meta-analysis. PLoS One, 2012. doi:10.1371/journal.pone.0052036
- 9.Magkos F, Fraterrigo G, Yoshino J, et al. Effects of Moderate and Subsequent Progressive Weight Loss on Metabolic Function and Adipose Tissue Biology in Humans with Obesity. Cell Metabolism, 2016. doi:10.1016/j.cmet.2016.02.005
- 10.Jiao B, Li L, Hao Y, Wu S, Jiang S. Exercise and Insulin-Resistance Biomarkers in Adults With Overweight/Obesity: A Network Meta-Analysis of Randomised Controlled Trials. Diabetes, Obesity and Metabolism, 2026. doi:10.1111/dom.71340
- 11.Chatzi CA, Basios A, Markozannes G, et al. Effect of Different Dietary Patterns on Cardiometabolic Risk Factors: An Umbrella Review of Systematic Reviews and Meta-Analyses. Nutrients, 2024. doi:10.3390/nu16223873
- 12.American Diabetes Association Professional Practice Committee. 2. Diagnosis and Classification of Diabetes: Standards of Care in Diabetes-2026. Diabetes Care, 2026. doi:10.2337/dc26-S002
- 13.Knopp JL, Holder-Pearson L, Chase JG. Insulin Units and Conversion Factors: A Story of Truth, Boots, and Faster Half-Truths. Journal of Diabetes Science and Technology, 2019. doi:10.1177/1932296818805074
- 14.Hegele RA, Maltman GM. Insulin's centenary: the birth of an idea. Lancet Diabetes & Endocrinology, 2020. doi:10.1016/S2213-8587(20)30337-5
- 15.Yalow RS, Berson SA. Immunoassay of endogenous plasma insulin in man. Journal of Clinical Investigation, 1960. doi:10.1172/JCI104130
- 16.Weyer C, Bogardus C, Mott DM, Pratley RE. The natural history of insulin secretory dysfunction and insulin resistance in the pathogenesis of type 2 diabetes mellitus. Journal of Clinical Investigation, 1999. doi:10.1172/JCI7231
- 17.Johnson JD. On the causal relationships between hyperinsulinaemia, insulin resistance, obesity and dysglycaemia in type 2 diabetes. Diabetologia, 2021. doi:10.1007/s00125-021-05505-4
- 18.Kraft JR. Detection of diabetes mellitus in situ (occult diabetes). Laboratory Medicine, 1975. doi:10.1093/labmed/6.2.10
- 19.Crofts C, Zinn C, Wheldon M, Schofield G. Hyperinsulinemia: A unifying theory of chronic disease?. Diabesity, 2015. doi:10.15562/diabesity.2015.19
- 20.Crofts C, Schofield G, Zinn C, Wheldon M, Kraft J. Identifying hyperinsulinaemia in the absence of impaired glucose tolerance: An examination of the Kraft database. Diabetes Research and Clinical Practice, 2016. doi:10.1016/j.diabres.2016.06.007
- 21.Knowler WC, Barrett-Connor E, Fowler SE, et al. Reduction in the incidence of type 2 diabetes with lifestyle intervention or metformin. New England Journal of Medicine, 2002. doi:10.1056/NEJMoa012512
- 22.Miller WG, Thienpont LM, Van Uytfanghe K, et al. Toward standardization of insulin immunoassays. Clinical Chemistry, 2009. doi:10.1373/clinchem.2008.118380
- 23.Jones AG, Hattersley AT. The clinical utility of C-peptide measurement in the care of patients with diabetes. Diabetic Medicine, 2013. doi:10.1111/dme.12159
- 24.Schleicher E, Kabytaev K, Nauck M, et al. Call for Standardization of C-Peptide Measurement. Journal of Diabetes Science and Technology, 2025. doi:10.1177/19322968251362848
- 25.Ascaso JF, Pardo S, Real JT, et al. Diagnosing insulin resistance by simple quantitative methods in subjects with normal glucose metabolism. Diabetes Care, 2003. doi:10.2337/diacare.26.12.3320
- 26.Esteghamati A, Ashraf H, Khalilzadeh O, et al. Optimal cut-off of homeostasis model assessment of insulin resistance (HOMA-IR) for the diagnosis of metabolic syndrome: third national surveillance of risk factors of non-communicable diseases in Iran (SuRFNCD-2007). Nutrition & Metabolism, 2010. doi:10.1186/1743-7075-7-26
- 27.Qu HQ, Li Q, Rentfro AR, Fisher-Hoch SP, McCormick JB. The definition of insulin resistance using HOMA-IR for Americans of Mexican descent using machine learning. PLoS One, 2011. doi:10.1371/journal.pone.0021041
- 28.Kun X, Roostaee A, Safarpour Lima Z, Rohani P. Comparative effects of ketogenic diets and mediterranean diets on obesity and metabolic outcomes: a systematic review and meta-analysis. Reviews in Endocrine and Metabolic Disorders, 2026. doi:10.1007/s11154-026-10086-x
- 29.Park J, Kim MS, Boo YK. The Effect of Time-Restricted Eating on Metabolic Risk Factors for Cardiovascular Disease and Non-Alcoholic Fatty Liver Disease in Overweight and Obese Adults: A Systematic Review and Meta-Analysis. Nutrition Reviews, 2026. doi:10.1093/nutrit/nuaf181
- 30.Sondrup N, Termannsen AD, Eriksen JN, et al. Effects of sleep manipulation on markers of insulin sensitivity: A systematic review and meta-analysis of randomized controlled trials. Sleep Medicine Reviews, 2022. doi:10.1016/j.smrv.2022.101594
- 31.Melin J, Forslund M, Alesi S, et al. The impact of metformin with or without lifestyle modification versus placebo on polycystic ovary syndrome: a systematic review and meta-analysis of randomized controlled trials. European Journal of Endocrinology, 2023. doi:10.1093/ejendo/lvad098
- 32.Tam CS, Xie W, Johnson WD, et al. Defining insulin resistance from hyperinsulinemic-euglycemic clamps. Diabetes Care, 2012. doi:10.2337/dc11-2339
- 33.Kawamoto R, Kikuchi A, Ninomiya D, Kumagi T, Abe M. Excessively Low Insulin Resistance May Increase the Risk of All-Cause Mortality Among Community-Dwelling Individuals Without Diabetes. Cureus, 2025. doi:10.7759/cureus.81773
- 34.Matthews DR, Hosker JP, Rudenski AS, et al. Homeostasis model assessment: insulin resistance and beta-cell function from fasting plasma glucose and insulin concentrations in man. Diabetologia, 1985. doi:10.1007/BF00280883
- 35.DeFronzo RA, Tobin JD, Andres R. Glucose clamp technique: a method for quantifying insulin secretion and resistance. American Journal of Physiology, 1979. doi:10.1152/ajpendo.1979.237.3.E214
- 36.Bonora E, Targher G, Alberiche M, et al. Homeostasis model assessment closely mirrors the glucose clamp technique in the assessment of insulin sensitivity: studies in subjects with various degrees of glucose tolerance and insulin sensitivity. Diabetes Care, 2000. doi:10.2337/diacare.23.1.57
- 37.Levy JC, Matthews DR, Hermans MP. Correct homeostasis model assessment (HOMA) evaluation uses the computer program. Diabetes Care, 1998. doi:10.2337/diacare.21.12.2191
- 38.Buzzetti R, Tuomi T, Mauricio D, et al. Management of Latent Autoimmune Diabetes in Adults: A Consensus Statement From an International Expert Panel. Diabetes, 2020. doi:10.2337/dbi20-0017
- 39.Cryer PE, Axelrod L, Grossman AB, et al. Evaluation and management of adult hypoglycemic disorders: an Endocrine Society Clinical Practice Guideline. Journal of Clinical Endocrinology and Metabolism, 2009. doi:10.1210/jc.2008-1410
- 40.Wallace TM, Levy JC, Matthews DR. Use and abuse of HOMA modeling. Diabetes Care, 2004. doi:10.2337/diacare.27.6.1487
- 41.Schroor MM, Joris PJ, Plat J, Mensink RP. Effects of Intermittent Energy Restriction Compared with Those of Continuous Energy Restriction on Body Composition and Cardiometabolic Risk Markers - A Systematic Review and Meta-Analysis of Randomized Controlled Trials in Adults. Advances in Nutrition, 2024. doi:10.1016/j.advnut.2023.10.003
- 42.Gayoso-Diz P, Otero-González A, Rodriguez-Alvarez MX, et al. Insulin resistance (HOMA-IR) cut-off values and the metabolic syndrome in a general adult population: effect of gender and age: EPIRCE cross-sectional study. BMC Endocrine Disorders, 2013. doi:10.1186/1472-6823-13-47
- 43.Yamada C, Mitsuhashi T, Hiratsuka N, et al. Optimal reference interval for homeostasis model assessment of insulin resistance in a Japanese population. Journal of Diabetes Investigation, 2011. doi:10.1111/j.2040-1124.2011.00113.x
- 44.Ai J, Jiang Y, Tang L. Effects of Time-Restricted Eating Combined with Exercise on Body Composition and Cardiometabolic Health in Adults with Overweight or Obesity: A Systematic Review and Meta-Analysis. Nutrition Reviews, 2026. doi:10.1093/nutrit/nuag137
- 45.Xing K, Liu R, Peng S, et al. Age-Specific Analysis of the Effects of Intermittent Fasting on Body Composition and Cardiometabolic Markers in Healthy Adults and Individuals with Overweight or Obesity: A Systematic Review and Meta-Analysis of Randomized Controlled Trials. Nutrients, 2026. doi:10.3390/nu18111799