
Hemoglobin A1c (glycated hemoglobin) (HbA1c)
Updated October 31, 2026 · 40 sources · Written by the AumniVIDA team
UnitsWhat is HbA1c?
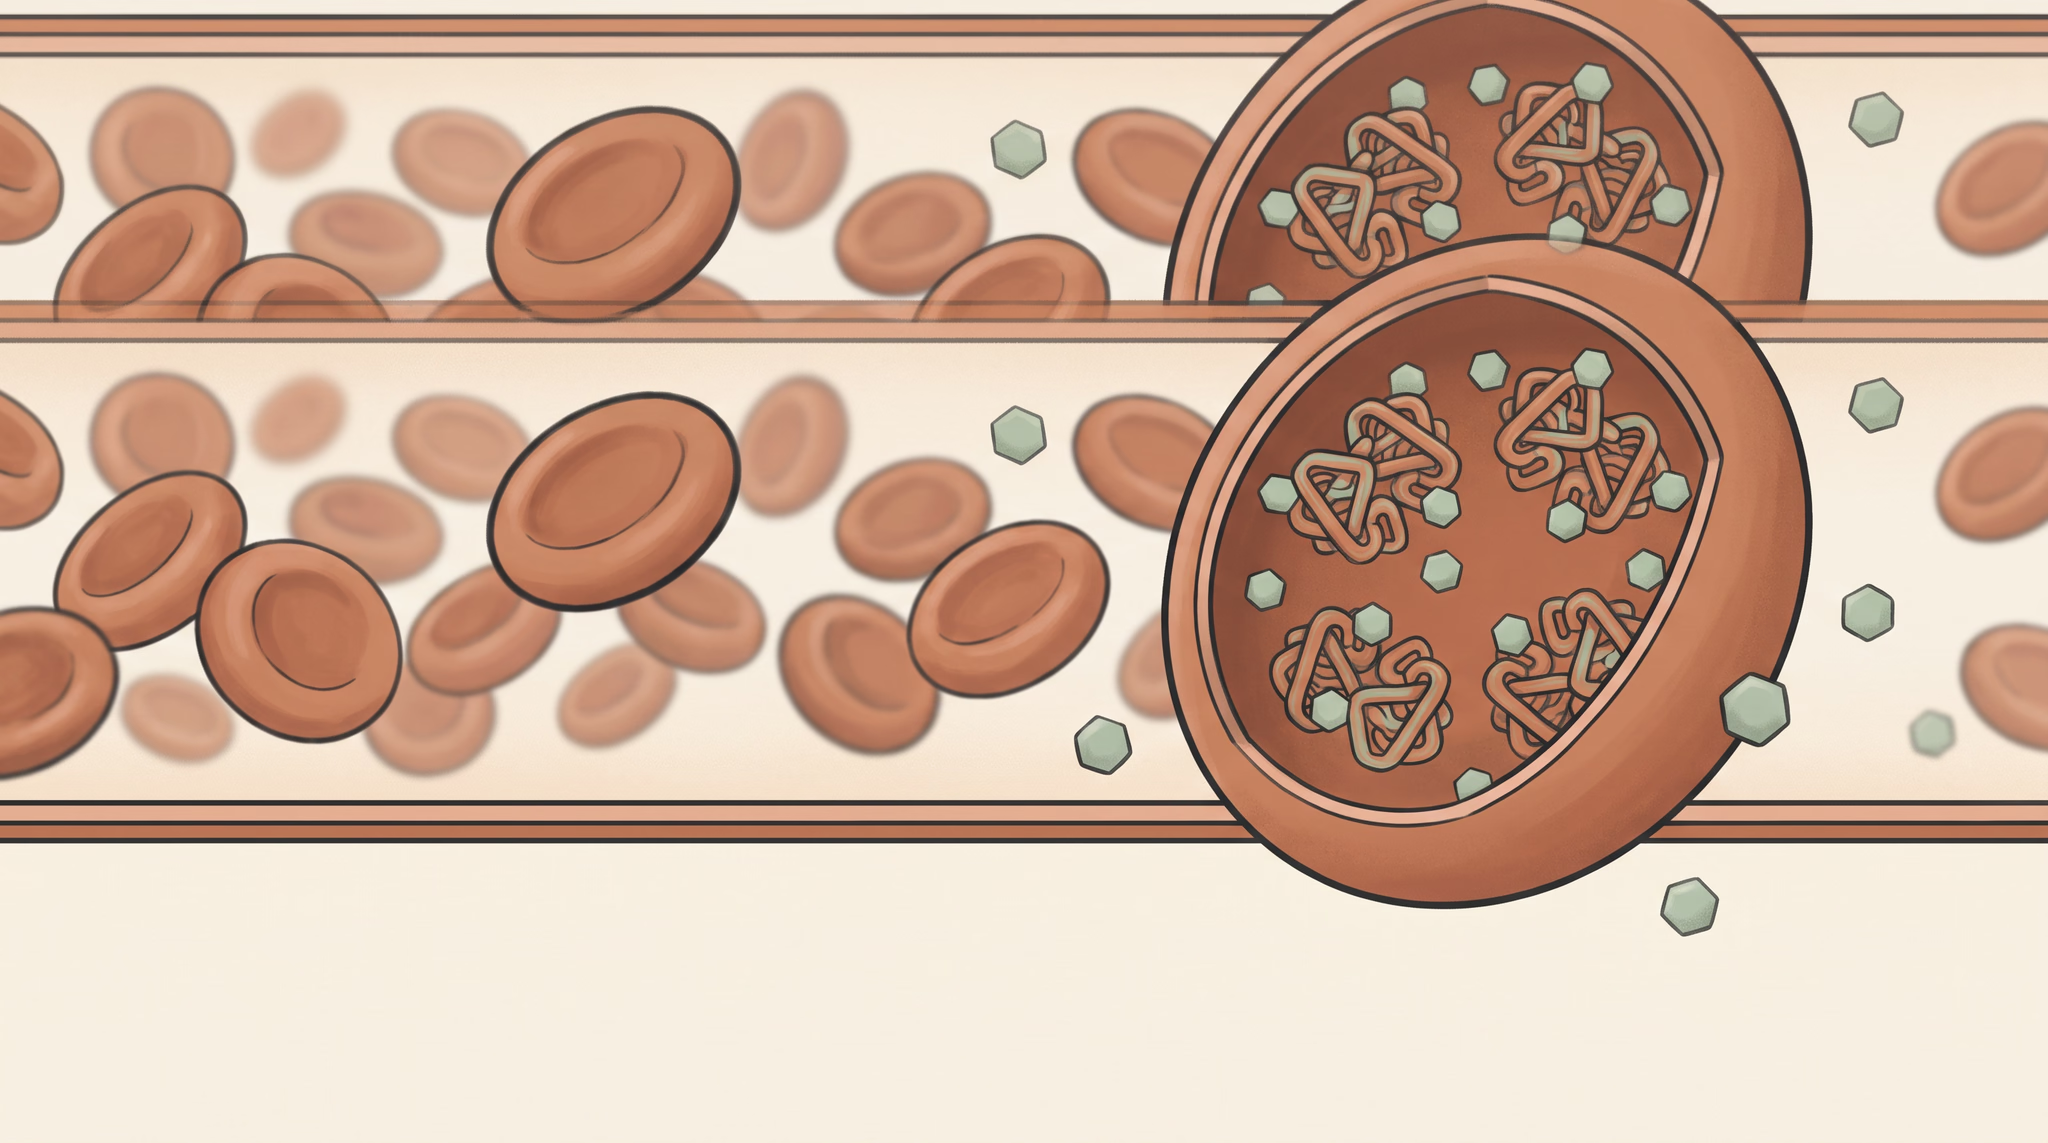
HbA1c (A1c) is the percentage of hemoglobin in red blood cells that has glucose attached. It reflects average blood glucose over roughly 2 to 3 months, needs no fasting, and diagnoses diabetes at 6.5% (48 mmol/mol)48 mmol/mol (6.5%) or higher. ADA calls 5.7 to 6.4% (39 to 47 mmol/mol)39 to 47 mmol/mol (5.7 to 6.4%) prediabetes .
Questions people ask about HbA1c
- 01HbA1c chart: normal, prediabetes and diabetes rangesA normal HbA1c is below 5.7% (39 mmol/mol)39 mmol/mol (5.7%). Prediabetes is 5.7 to 6.4% (39 to 47 mmol/mol)39 to 47 mmol/mol (5.7 to 6.4%), and 6.5% (48 mmol/mol)48 mmol/mol (6.5%) or higher is in the diabetes range, confirmed by a second test. These ADA thresholds apply at every age; NICE starts its high-risk range at 6.0% (42 mmol/mol)42 mmol/mol (6.0%) .Read the answer
- 02How to lower HbA1cWeight loss, diet pattern, structured exercise and medication lower HbA1c most. In type 2 diabetes trials, each kilogram lost lowered it about 0.1 points, a Mediterranean diet 0.47, structured aerobic exercise 0.73 and tirzepatide 2.10 versus placebo. Because red cells turn over slowly, changes take about 3 months to show .Read the answer
- 03What does a high HbA1c mean?A high HbA1c means more hemoglobin has glucose attached, usually because average glucose has been raised for months.Read the answer
- 04HbA1c to average glucose: conversion chartEstimated average glucose (eAG) in mg/dL equals 28.7 x A1c minus 46.7, from the ADAG study of 507 people.Read the answer
- 05HbA1c test: fasting, home kits and how oftenThe HbA1c test needs no fasting and is unaffected by a recent meal, stress or exercise.Read the answer
Key takeaways
What is HbA1c?
HbA1c, or A1c, is the share of hemoglobin in your red blood cells that has glucose attached. It is reported as a percentage (NGSP/DCCT units) or in mmol/mol (IFCC units) and reflects average blood glucose over roughly the past 2 to 3 months [3].
Hemoglobin is the oxygen-carrying protein that fills red blood cells. Glucose in the blood binds to it slowly and stays bound, so the more glucose you carry around day and night, the higher the share of hemoglobin that ends up glycated [1].
Labs report the result in two units. The US and many other countries use percent, traceable to the assay used in the DCCT trial through the National Glycohemoglobin Standardization Program [9]. The UK, Europe and Australia use mmol/mol, the International Federation of Clinical Chemistry (IFCC) unit [10].
The test goes by several names: HbA1c, A1c, hemoglobin A1c, glycated hemoglobin and glycohemoglobin all mean the same measurement.
Doctors use HbA1c for three jobs: to screen for and diagnose diabetes, to flag prediabetes, and to track how well glucose is controlled in people who already have diabetes [3] [11]. It needs no fasting and changes little with a single meal, a stressful day or a short illness, which is why it is so widely used [3].
How does glucose turn into HbA1c?
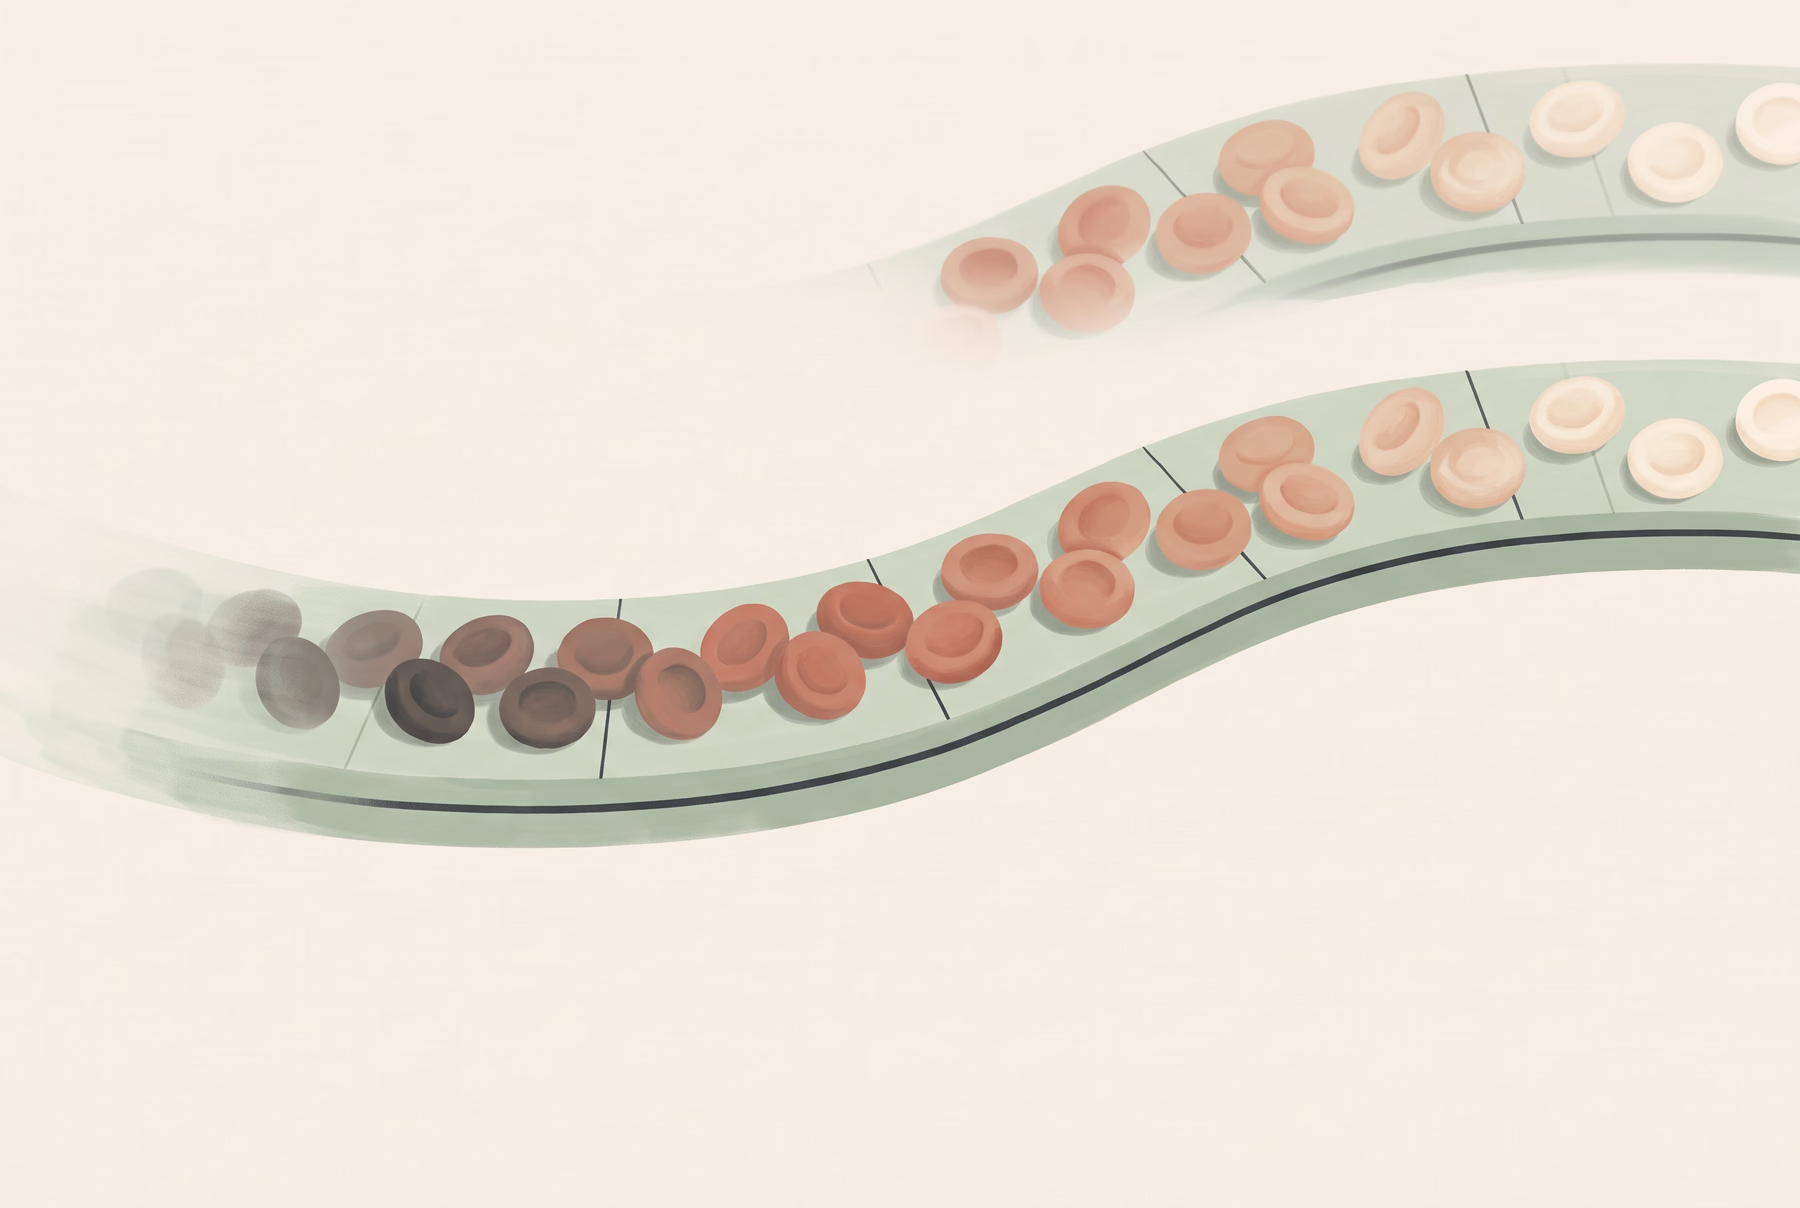
Glucose attaches to the end of the hemoglobin beta chain without any enzyme, a process called glycation. The bond forms slowly and lasts for the red cell's life of about 120 days, so HbA1c builds up in proportion to the glucose each cell is exposed to [1].
Glycation is a chemical reaction, not a biological signal. Glucose reacts with the N-terminal amino group of the beta chain of hemoglobin A, first forming a reversible link and then a stable one. In 1976, Bunn and colleagues used labeled iron to follow newly made red cells and found HbA1c rising slowly over about 60 days, consistent with a non-enzymatic process across the 120-day life of the cell [1].
Two consequences follow:
- Recent weeks count most. Older red cells carry more glucose but are removed first, and new cells start clean. HbA1c is a weighted average in which the last few weeks weigh more than the months before. When glucose was normalized in newly diagnosed patients, HbA1c fell with a half-time of about 35 days, and its weighting extended back about 100 days [2].
- Red cell lifespan matters. Anything that shortens red cell life lowers HbA1c, and anything that lengthens it raises HbA1c, even when glucose is unchanged. People with hemolysis had markedly lower HbA1c in the original work [1], and even in healthy people the mean age of red cells varied from 38 to 60 days, enough to change HbA1c in a clinically meaningful way [12].
This is why HbA1c is a strong summary of glucose exposure for most people and a misleading one for some.
Why HbA1c reflects about 3 months, weighted to recent weeks
- Counts most
- TodayNewest red cellsThey start clean and carry the least glucose, but recent weeks weigh most in the result.
- About 35 daysHalf-time of changeAfter glucose is normalized, HbA1c falls by half in about 35 days.
- Counts less
- About 60 daysGlycation keeps buildingIn labeled new cells, HbA1c rose slowly over about 60 days.
- About 100 daysWeighting fades outGlucose from this far back adds little to today's HbA1c.
- About 120 daysOldest cells are removedThey carry the most glucose but leave circulation first.
Red cell lifespan differs between healthy people (mean cell age 38 to 60 days in one study), which shifts HbA1c at the same glucose (Cohen 2008).
Why does HbA1c matter?
HbA1c predicts the complications of diabetes. In the DCCT and UKPDS trials, lowering it reduced eye, kidney and nerve damage, and each 1 point lower HbA1c in type 2 diabetes was linked to 37% fewer microvascular complications [13] [4].
The DCCT randomized 1,441 people with type 1 diabetes to intensive or conventional treatment. Over a mean 6.5 years, intensive control reduced new retinopathy by 76%, albuminuria by 54% and clinical neuropathy by 60%, with two to three times more severe hypoglycemia [13].
The UKPDS did the same in newly diagnosed type 2 diabetes. A median HbA1c of 7.0% versus 7.9% over 10 years lowered microvascular endpoints by 25% [14]. In the observational analysis of the same cohort, every 1 point lower updated mean HbA1c was associated with 21% fewer diabetes-related endpoints, 14% fewer heart attacks and 37% fewer microvascular complications, with no threshold below which risk stopped falling [4].
Risk starts below the diabetes range. In the ARIC study of 11,092 adults without diabetes, HbA1c of 5.5 to 5.9% carried 1.86 times the risk of later diagnosed diabetes compared with 5.0 to 5.4%, and 6.0 to 6.4% carried 4.48 times the risk. Coronary heart disease risk rose too, and HbA1c predicted cardiovascular outcomes better than fasting glucose [5].
HbA1c is one part of a metabolic picture. Fasting insulin can show insulin resistance years before HbA1c moves, and triglycerides and ApoB carry the cardiovascular side of the same story.
| Study | Who | What it showed |
|---|---|---|
| DCCT, 1993 | 1,441 people with type 1 diabetes | Intensive control cut new retinopathy by 76% and neuropathy by 60% |
| UKPDS 33, 1998 | 3,867 people with new type 2 diabetes | Median 7.0% vs 7.9% cut microvascular endpoints by 25% |
| UKPDS 35, 2000 | 4,585 people with type 2 diabetes | Each 1 point lower: 21% fewer diabetes endpoints, 37% fewer microvascular |
| ARIC, 2010 | 11,092 adults without diabetes | Diabetes and heart disease risk rose from 5.5%, more than with fasting glucose |
| ADAG, 2008 | 507 people with and without diabetes | Average glucose = 28.7 x A1c minus 46.7 mg/dL |
Future diabetes risk by baseline HbA1c in adults without diabetes
- Below 5.0%0.52 hazard ratio for diagnosed diabetes
- 5.0 to 5.4% (reference)1 hazard ratio for diagnosed diabetes
- 5.5 to 5.9%1.86 hazard ratio for diagnosed diabetes
- 6.0 to 6.4%4.48 hazard ratio for diagnosed diabetes
- 6.5% or higher16.47 hazard ratio for diagnosed diabetes
Show the data
| Item | Value (hazard ratio for diagnosed diabetes) | Low | High | Note |
|---|---|---|---|---|
| Below 5.0% | 0.52 | 0.4 | 0.69 | |
| 5.0 to 5.4% (reference) | 1 | |||
| 5.5 to 5.9% | 1.86 | 1.67 | 2.08 | |
| 6.0 to 6.4% | 4.48 | 3.92 | 5.13 | |
| 6.5% or higher | 16.47 | 14.22 | 19.08 |
How do you read HbA1c results?
Under 5.7% (39 mmol/mol)39 mmol/mol (5.7%) is normal by ADA criteria, 5.7 to 6.4% (39 to 47 mmol/mol)39 to 47 mmol/mol (5.7 to 6.4%) is prediabetes, and 6.5% (48 mmol/mol)48 mmol/mol (6.5%) or higher is in the diabetes range. A diagnosis needs a confirming test [3].
Guidelines agree on the diabetes threshold and differ on the risk range below it. ADA uses 5.7 to 6.4% for prediabetes [3]. WHO endorses 6.5% for diagnosis but found too little evidence to define any category below it [15]. NICE and the International Expert Committee start the high-risk range at 6.0% (42 mmol/mol)42 mmol/mol (6.0%) [16] [17].
Converting units. The IFCC and NGSP scales are linked by NGSP % = 0.915 x IFCC % + 2.15 [10]. Rearranged, that gives:
- mmol/mol = 10.929 x (A1c % minus 2.15)
- A1c % = (mmol/mol / 10.929) + 2.15
So 5.7% is 39 mmol/mol, 6.5% is 48 mmol/mol and 7.0% is 53 mmol/mol. The full chart from 4% to 14%, with estimated average glucose, is on the HbA1c chart page, and the glucose conversion is explained on the average glucose page.
One result is not a diagnosis. Without obvious symptoms, ADA requires two abnormal results, either two different tests from the same sample or the same test repeated, and a clinician should check for anything that could distort either test [3]. For people who already have diabetes, ADA suggests a goal below 7% (53 mmol/mol)53 mmol/mol (7%) for many nonpregnant adults, set individually [11].
| Category | ADA Standards of Care 2026 | WHO 2011 | NICE PH38 | International Expert Committee 2009 |
|---|---|---|---|---|
| Normal | Below 5.7% (below 39 mmol/mol) | No formal threshold below 6.5% | Below 6.0% (below 42 mmol/mol) | No lower threshold set |
| Raised risk | Prediabetes: 5.7 to 6.4% (39 to 47 mmol/mol)39 to 47 mmol/mol (5.7 to 6.4%) | Insufficient evidence for a formal category | High risk: 6.0 to 6.4% (42 to 47 mmol/mol)42 to 47 mmol/mol (6.0 to 6.4%) | 6.0 to 6.4% (42 to 47 mmol/mol)42 to 47 mmol/mol (6.0 to 6.4%): offer prevention |
| Diabetes | 6.5% (48 mmol/mol)48 mmol/mol (6.5%) or higher, confirmed | 6.5% (48 mmol/mol)48 mmol/mol (6.5%) or higher | 6.5% (48 mmol/mol)48 mmol/mol (6.5%) or higher, second test | 6.5% (48 mmol/mol)48 mmol/mol (6.5%) or higher, repeat test |
| Goal with diabetes | Below 7% (53 mmol/mol)53 mmol/mol (7%) for many adults | Not covered | Not covered | Not covered |
HbA1c ranges in percent: normal, prediabetes and diabetes
- Normal
- 4 to 5.7
- Prediabetes
- 5.7 to 6.5
- Diabetes range
- 6.5 to 9
- 5.7 %: ADA prediabetes
- 6 %: NICE and IEC high risk
- 6.5 %: ADA and WHO diagnosis
- 7 %: ADA goal for many with diabetes
When can HbA1c be misleading?
HbA1c misleads when red cells live shorter or longer than usual or when the assay is disturbed. Iron deficiency can raise it; blood loss, hemolysis, pregnancy, some hemoglobin variants and G6PD deficiency can lower it. In those cases ADA advises plasma glucose for diagnosis [3].
Because HbA1c depends on how long red cells circulate, anything that changes red cell turnover changes the number. ADA lists anemia, iron status, splenectomy, blood loss, transfusion, hemolysis, G6PD deficiency, erythropoietin, HIV, cirrhosis, kidney failure, dialysis and pregnancy [3].
- Iron deficiency raises HbA1c without any change in glucose, while other anemias may lower it [6]. If you have low ferritin, read a borderline HbA1c with care.
- Hemoglobin variants such as sickle cell trait can interfere with some assays. At the same fasting glucose, African Americans with sickle cell trait had HbA1c about 0.29 points lower [7]. ADA recommends an assay free of variant interference [3].
- G6PD deficiency. The G202A variant, carried by 11% of Black people in the US, lowers HbA1c by about 0.8 points in homozygous men and 0.7 in homozygous women [3].
- Pregnancy speeds red cell turnover, so HbA1c runs slightly lower [18].
- Kidney disease. HbA1c becomes less accurate as kidney function falls, especially with dialysis [19].
- Ancestry and age. In adults without diabetes, HbA1c ran 0.26 points higher in Black, 0.24 higher in Asian and 0.08 higher in Latino people than in White people [20], and it rises about 0.01 points per year of age [21]. Whether these gaps reflect glucose or red cell biology is still debated, and guidelines use the same thresholds for everyone [3].
What to use instead. When HbA1c is unreliable, ADA says plasma glucose should be used for diagnosis, and fructosamine, glycated albumin or continuous glucose monitoring (CGM) for monitoring [3] [11]. Fructosamine reflects roughly the past 30 days, compared with about 100 days for HbA1c [2]. CGM reports average glucose and time in range directly [22].
| Condition | Direction | Typical size | Source |
|---|---|---|---|
| Iron deficiency, with or without anemia | Higher | Raised HbA1c with no rise in glucose | English 2015 systematic review |
| Other anemias, hemolysis, blood loss, transfusion | Lower | Varies with red cell survival | Bunn 1976; ADA 2026 |
| Normal variation in red cell lifespan | Either | Mean cell age 38 to 60 days in healthy people | Cohen 2008 |
| Sickle cell trait (some assays) | Lower | About 0.3 points at the same glucose | Lacy 2017 |
| G6PD deficiency (G202A variant) | Lower | About 0.7 to 0.8 points in homozygous people | ADA 2026 |
| Black, Asian or Latino ancestry vs White | Higher | 0.26, 0.24 and 0.08 points | Cavagnolli 2017 |
| Age | Higher | About 0.01 points per year | Pani 2008 |
| Pregnancy | Lower | Slightly lower from faster red cell turnover | ADA 2026 pregnancy |
| Advanced kidney disease, dialysis, erythropoietin | Either | Accuracy falls as kidney function declines | ADA 2026; Galindo 2023 |
| HIV, cirrhosis, splenectomy | Either | Listed as altering the HbA1c to glucose link | ADA 2026 |
When HbA1c and glucose disagree
HbA1c and glucose disagree
- HbA1c reads higher than glucose suggestsIron deficiency, Black, Asian or Latino ancestry (0.08 to 0.26 points), older age
- HbA1c reads lower than glucose suggestsBlood loss, hemolysis, transfusion, sickle cell trait (about 0.3 points), G6PD deficiency (0.7 to 0.8 points), pregnancy
- Either directionKidney disease, dialysis, erythropoietin, HIV, cirrhosis, splenectomy
- A hemoglobin variant is possibleAsk whether the lab assay is free of variant interference
- Diagnosis is the questionUse plasma glucose criteria
- Monitoring is the questionUse fructosamine, glycated albumin or CGM
Sizes are group averages from the cited studies (ADA 2026, Lacy 2017, Cavagnolli 2017). A clinician decides which test fits your situation.
What changes HbA1c?
Weight loss, diet pattern, structured exercise and medication all lower HbA1c, mostly by lowering average glucose. In trials of people with type 2 diabetes, each kilogram lost lowered it by about 0.1 points and structured aerobic exercise by 0.73 points [23] [24].
The levers that move HbA1c are the ones that lower glucose across the whole day:
- Weight loss has the most consistent dose response: about 0.1 points per kilogram in trials of type 2 diabetes [23].
- Diet pattern. A Mediterranean diet lowered HbA1c by 0.47 points versus lower-fat diets [25]; low-carbohydrate diets lowered it by 0.47 at 3 months but not by 12 months [26]; more fibre lowered it by 2.0 mmol/mol [27].
- Exercise. Structured training of more than 150 minutes a week lowered it by 0.89 points [24].
- Medication. Most oral diabetes drugs lower HbA1c by 0.5 to 1.25 points [28], and GLP-1 receptor agonists by more, up to 2.10 points for tirzepatide versus placebo [29]. Medication decisions belong with a clinician.
Because of the slow turnover of red cells, a real change takes about 3 months to show fully [2]. The how to lower HbA1c page ranks every lever by effect size. AumniVIDA's glucose stability, Mediterranean, keto and low-carb and time-restricted eating protocols track the habits behind these numbers.
How much each lever lowers HbA1c
- Tirzepatide vs placebo2.1 percentage points lower
Network meta-analysis of 76 trials (Yao 2024)
- Lose 10 kg1 percentage points lower
Modeled at 0.1 points per kg across 58 trials (Gummesson 2017)
- Structured exercise over 150 min a week0.89 percentage points lower
Umpierre 2011
- Structured aerobic exercise0.73 percentage points lower
Umpierre 2011
- Mediterranean diet vs lower-fat diet0.47 percentage points lower
Esposito 2015
- Low-carbohydrate diet, at 3 months0.47 percentage points lower
No difference by 12 months (Sainsbury 2018)
- Normal vs short sleep0.23 percentage points lower
Observational association (Lee 2017)
- More dietary fibre0.18 percentage points lower
2.0 mmol/mol converted to % points (Reynolds 2020)
Show the data
| Item | Value (percentage points lower) | Low | High | Note |
|---|---|---|---|---|
| Tirzepatide vs placebo | 2.1 | 1.74 | 2.47 | Network meta-analysis of 76 trials (Yao 2024) |
| Lose 10 kg | 1 | Modeled at 0.1 points per kg across 58 trials (Gummesson 2017) | ||
| Structured exercise over 150 min a week | 0.89 | Umpierre 2011 | ||
| Structured aerobic exercise | 0.73 | 0.4 | 1.06 | Umpierre 2011 |
| Mediterranean diet vs lower-fat diet | 0.47 | 0.38 | 0.56 | Esposito 2015 |
| Low-carbohydrate diet, at 3 months | 0.47 | 0.23 | 0.71 | No difference by 12 months (Sainsbury 2018) |
| Normal vs short sleep | 0.23 | 0.1 | 0.36 | Observational association (Lee 2017) |
| More dietary fibre | 0.18 | 0.06 | 0.3 | 2.0 mmol/mol converted to % points (Reynolds 2020) |
Where did the HbA1c test come from?
Samuel Rahbar reported a raised hemoglobin fraction in diabetes in 1968. By 1976 it was shown to track glucose control, the DCCT and UKPDS tied it to complications, and standardization let ADA and WHO adopt 6.5% for diagnosis in 2010 and 2011 [30] [31] [15].
The path from discovery to diagnosis took four decades:
- 1968: Rahbar found an abnormal fast-moving hemoglobin in the red cells of people with diabetes [30].
- 1976: Bunn showed that HbA1c forms slowly over the red cell's life [1], and Koenig showed that it fell from 9.8% to 5.8% as patients' glucose control improved [31].
- 1993 and 1998: The DCCT and UKPDS made HbA1c the standard measure of treatment success [13] [14].
- 1996 to 2004: The NGSP aligned US labs to the DCCT assay [9], and the IFCC built a reference method linked to it [10].
- 2008 to 2011: The ADAG study translated HbA1c into average glucose [8], the International Expert Committee proposed 6.5% for diagnosis [17], ADA adopted it with a 5.7% risk threshold [32], and WHO followed [15].
From a lab curiosity to a diagnostic test
1968
Rahbar finds a raised hemoglobin fraction in diabetes
1976
HbA1c shown to form slowly over the red cell's life and to track glucose control
1993
DCCT links lower HbA1c to fewer complications in type 1 diabetes
1996
NGSP makes US results traceable to the DCCT assay
1998
UKPDS shows the same in type 2 diabetes
2004
IFCC reference method links % to mmol/mol
2008
ADAG study converts HbA1c to average glucose
2009
International Expert Committee backs 6.5% for diagnosis
2010
ADA adopts HbA1c for diagnosis and the 5.7% risk threshold
2011
WHO endorses 6.5% as the diagnostic cut point
2018
CGM estimate renamed glucose management indicator
What does the evidence not show about HbA1c?
The evidence does not define a healthy HbA1c below the prediabetes range, does not prove that lowering a normal HbA1c prevents disease, and does not set age-specific or ancestry-specific thresholds. WHO found too little evidence to interpret values below 6.5% [15].
- No proven optimal number in people without diabetes. Risk in ARIC rose from 5.5% [5], but no trial has shown that lowering an HbA1c of, say, 5.4% to 5.0% prevents disease. Claims of an optimal longevity range go beyond the data.
- Very low is not clearly better. In ARIC, HbA1c below 5.0% was linked to 32% higher all-cause mortality than 5.0 to 5.7%, likely because low values flag other conditions such as anemia [33].
- Lifestyle effect sizes come mostly from type 2 diabetes. People starting near normal have less to lower, and higher baseline HbA1c predicts a bigger drop [23] [28].
- Short-term diet effects can fade. Low-carbohydrate diets lowered HbA1c at 3 and 6 months, but the difference was gone at 12 and 24 months [26].
- Age and ancestry. HbA1c rises with age and differs by ancestry in people without diabetes [21] [20], but there is no agreement on separate thresholds [3].
- CGM estimates do not replace the lab test. In people without diabetes, the CGM-based GMI ran 0.59 points above lab HbA1c on average [34].
The research
Foundational studies
The work that established what this marker means.
- 1968An abnormal hemoglobin in red cells of diabetics.Clinica Chimica ActaRahbar reported a fast-moving hemoglobin fraction that was raised in people with diabetes, later identified as HbA1c.
- 1976The biosynthesis of human hemoglobin A1c. Slow glycosylation of hemoglobin in vivo.Journal of Clinical InvestigationHbA1c forms slowly and probably non-enzymatically when glucose binds the N-terminal amino group of the hemoglobin beta chain over the 120-day life of the red cell, and shortened red cell survival lowers it.
- 1976Correlation of glucose regulation and hemoglobin AIc in diabetes mellitus.New England Journal of MedicineWhen glucose control improved in five patients, HbA1c fell from a mean 9.8% to 5.8%, showing that it tracks mean blood sugar over the previous weeks to months.
- 1993The effect of intensive treatment of diabetes on the development and progression of long-term complications in insulin-dependent diabetes mellitus.New England Journal of MedicineIn 1,441 people with type 1 diabetes, intensive glucose control cut new retinopathy by 76%, clinical neuropathy by 60% and albuminuria by 54% over a mean 6.5 years, at the cost of two to three times more severe hypoglycemia.
- 1995Kinetics of HbA1c, glycated albumin, and fructosamine and analysis of their weight functions against preceding plasma glucose level.Diabetes CareAfter glucose was normalized, HbA1c fell with a half-time of about 35 days; it reflects a weighted mean of glucose over roughly 100 days, with the most recent days weighted most.
- 1998Intensive blood-glucose control with sulphonylureas or insulin compared with conventional treatment and risk of complications in patients with type 2 diabetes (UKPDS 33).LancetOver 10 years, a median HbA1c of 7.0% versus 7.9% lowered microvascular endpoints by 25% and any diabetes-related endpoint by 12% in newly diagnosed type 2 diabetes.
- 2000Association of glycaemia with macrovascular and microvascular complications of type 2 diabetes (UKPDS 35): prospective observational study.BMJEach 1 percentage point lower updated mean HbA1c was associated with 21% fewer diabetes-related endpoints, 14% fewer heart attacks and 37% fewer microvascular complications, with no threshold.
- 2001The national glycohemoglobin standardization program: a five-year progress report.Clinical ChemistryThe NGSP, launched in 1996, made laboratory results traceable to the DCCT assay, and by 2000 most certified methods agreed within 0.8% HbA1c of target.
- 2002Reduction in the incidence of type 2 diabetes with lifestyle intervention or metformin.New England Journal of MedicineIn 3,234 adults with raised glucose, a lifestyle program aiming at 7% weight loss and 150 minutes of weekly activity cut new diabetes by 58% and metformin by 31% over 2.8 years.
- 2004IFCC reference system for measurement of hemoglobin A1c in human blood and the national standardization schemes in the United States, Japan, and Sweden: a method-comparison study.Clinical ChemistryThe IFCC reference method and the US NGSP scale are linearly linked by NGSP HbA1c = 0.915 x IFCC HbA1c + 2.15%, the basis of the conversion between % and mmol/mol.
- 2008Translating the A1C assay into estimated average glucose values.Diabetes CareIn 507 people with about 2,700 glucose readings each over 3 months, average glucose (mg/dL) equaled 28.7 x A1C minus 46.7, with R squared 0.84 and no significant difference by age, sex, diabetes type or ethnicity.
- 2008Red cell life span heterogeneity in hematologically normal people is sufficient to alter HbA1c.BloodMean red cell age ranged from 38 to 60 days in healthy people, enough variation to cause clinically important differences in HbA1c at the same mean glucose.
- 2008Effect of aging on A1C levels in individuals without diabetes: evidence from the Framingham Offspring Study and the National Health and Nutrition Examination Survey 2001-2004.Diabetes CareA1C rose about 0.01 to 0.014 percentage points per year of age in adults without diabetes, and the 97.5th percentile moved from 5.6 to 6.0% under age 40 to 6.2 to 6.6% at 70 and over.
- 2010Glycated hemoglobin, diabetes, and cardiovascular risk in nondiabetic adults.New England Journal of MedicineAmong 11,092 ARIC adults without diabetes, HbA1c predicted future diabetes and coronary heart disease in graded fashion from 5.5% upward and outperformed fasting glucose for cardiovascular risk.
- 2012Low hemoglobin A(1c) in nondiabetic adults: an elevated risk state?Diabetes CareIn ARIC, HbA1c below 5.0% was linked to 32% higher all-cause mortality than 5.0 to 5.7%, a pattern that likely marks other conditions such as anemia rather than harm from low glucose.
- 2017Association of Sickle Cell Trait With Hemoglobin A1c in African Americans.JAMAAt the same fasting glucose, African Americans with sickle cell trait had HbA1c about 0.29 percentage points lower than those without it.
- 2018Primary care-led weight management for remission of type 2 diabetes (DiRECT): an open-label, cluster-randomised trial.LancetA total diet replacement program produced remission (HbA1c below 6.5% off medication) in 46% of participants at 12 months versus 4% of controls, and in 86% of those who lost 15 kg or more.
Guidelines and reviews
Where expert bodies and systematic reviews have landed.
- 2009International Expert Committee report on the role of the A1C assay in the diagnosis of diabetes.Diabetes CareThe committee set an A1C of 6.5% or higher as the diabetes threshold, based on the rise in retinopathy, and said people at 6.0% or above should receive proven prevention.
- 2010Diagnosis and classification of diabetes mellitus.Diabetes CareThe ADA first adopted an A1C of 6.5% or higher for diagnosis and named 5.7% as the start of a high-risk range in its 2010 standards.
- 2010The effect of oral antidiabetic agents on A1C levels: a systematic review and meta-analysis.Diabetes CareAcross 61 placebo-controlled trials, most oral diabetes drugs lowered A1C by 0.5 to 1.25 points, with most of the benefit in the first 4 to 6 months.
- 2011Use of glycated haemoglobin (HbA1c) in diagnosis of diabetes mellitus: abbreviated report of a WHO consultationWorld Health OrganizationWHO recommends an HbA1c of 6.5% as the cut point for diagnosing diabetes and found insufficient evidence for any formal interpretation of values below 6.5%.
- 2011Physical activity advice only or structured exercise training and association with HbA1c levels in type 2 diabetes: a systematic review and meta-analysis.JAMAAcross 47 trials, structured aerobic exercise lowered HbA1c by 0.73 points and more than 150 minutes a week by 0.89 points, while activity advice helped only alongside diet advice.
- 2012Type 2 diabetes: prevention in people at high risk (PH38)NICE public health guidelineNICE treats an HbA1c of 6.0 to 6.4% (42 to 47 mmol/mol)42 to 47 mmol/mol (6.0 to 6.4%) as high risk of type 2 diabetes, offers a yearly blood test to that group, and requires a second test after a result of 6.5% (48 mmol/mol)48 mmol/mol (6.5%) or more.
- 2015The effect of anaemia and abnormalities of erythrocyte indices on HbA1c analysis: a systematic review.DiabetologiaIron deficiency, with or without anemia, raises HbA1c without any rise in glucose, while other anemias may lower it.
- 2015A journey into a Mediterranean diet and type 2 diabetes: a systematic review with meta-analyses.BMJ OpenIn long-term trials, a Mediterranean diet lowered HbA1c by 0.47 points more than control diets, mostly lower-fat diets, and four meta-analyses agreed on 0.30 to 0.47 points.
- 2017Effect of ethnicity on HbA1c levels in individuals without diabetes: Systematic review and meta-analysis.PLoS OneIn 49,238 adults without diabetes, HbA1c was 0.26 points higher in Black, 0.24 higher in Asian and 0.08 higher in Latino people than in White people.
- 2017Effect of weight reduction on glycated haemoglobin in weight loss trials in patients with type 2 diabetes.Diabetes, Obesity and MetabolismAcross 58 weight loss trials with 17,204 people with type 2 diabetes, each kilogram lost lowered HbA1c by about 0.1 percentage points, more when baseline HbA1c was high.
- 2017The impact of sleep amount and sleep quality on glycemic control in type 2 diabetes: A systematic review and meta-analysis.Sleep Medicine ReviewsIn type 2 diabetes, short sleep was associated with 0.23 points higher HbA1c, long sleep with 0.13 points higher and poor sleep quality with 0.35 points higher than normal sleep.
- 2018Effect of dietary carbohydrate restriction on glycemic control in adults with diabetes: A systematic review and meta-analysis.Diabetes Research and Clinical PracticeDiets with under 26% of energy from carbohydrate lowered HbA1c by 0.47 points at 3 months and 0.36 at 6 months versus higher-carbohydrate diets, with no difference at 12 or 24 months.
- 2018Glucose Management Indicator (GMI): A New Term for Estimating A1C From Continuous Glucose Monitoring.Diabetes CareThe authors renamed estimated A1C from CGM as the glucose management indicator, calculated as GMI (%) = 3.31 + 0.02392 x mean glucose in mg/dL, and explained why it can differ from a lab A1C.
- 2019Clinical Targets for Continuous Glucose Monitoring Data Interpretation: Recommendations From the International Consensus on Time in Range.Diabetes CareAn international consensus set standard CGM metrics and targets, such as time in range, to complement A1C in diabetes care.
- 2020Dietary fibre and whole grains in diabetes management: Systematic review and meta-analyses.PLoS MedicineRaising fibre intake lowered HbA1c by 2.0 mmol/mol across 33 trials in adults with prediabetes or diabetes.
- 20262. Diagnosis and Classification of Diabetes: Standards of Care in Diabetes-2026.Diabetes CareDiabetes is diagnosed at an A1C of 6.5% (48 mmol/mol)48 mmol/mol (6.5%) or higher, confirmed by a second abnormal test, and prediabetes spans 5.7 to 6.4% (39 to 47 mmol/mol)39 to 47 mmol/mol (5.7 to 6.4%); A1C needs no fasting but is unreliable when red cell turnover, hemoglobin variants or pregnancy alter it.
- 20266. Glycemic Goals, Hypoglycemia, and Hyperglycemic Crises: Standards of Care in Diabetes-2026.Diabetes CareAn A1C goal below 7% (53 mmol/mol)53 mmol/mol (7%) suits many nonpregnant adults with diabetes, glycemic status should be checked at least twice a year, and fructosamine or CGM can stand in when A1C is unreliable.
- 202615. Management of Diabetes in Pregnancy: Standards of Care in Diabetes-2026.Diabetes CareA1C runs slightly lower in pregnancy because red cells turn over faster, and the ideal goal in pregnancy with diabetes is below 6% (42 mmol/mol)42 mmol/mol (6%) if reached without significant hypoglycemia.
Recent research
Notable work from the last three years.
- 2023Discordance Between Glucose Management Indicator and Glycated Hemoglobin in People Without Diabetes.Diabetes Technology and TherapeuticsIn 153 people without diabetes, CGM-derived GMI ran 0.59 points higher than lab HbA1c on average, and 71% had a gap of 0.4 points or more.
- 2023Mechanisms of weight loss-induced remission in people with prediabetes: a post-hoc analysis of the randomised, controlled, multicentre Prediabetes Lifestyle Intervention Study (PLIS).Lancet Diabetes and EndocrinologyAmong people with prediabetes who lost at least 5% of body weight, 43% returned to normal glucose and HbA1c below 39 mmol/mol, and they had 73% lower risk of type 2 diabetes over the next 2 years.
- 2023Continuous Glucose Monitoring to Optimize Management of Diabetes in Patients with Advanced CKD.Clinical Journal of the American Society of NephrologyHbA1c accuracy falls as kidney function declines, and CGM offers a better view of glucose in advanced chronic kidney disease.
- 2024Comparative effectiveness of GLP-1 receptor agonists on glycaemic control, body weight, and lipid profile for type 2 diabetes: systematic review and network meta-analysis.BMJAcross 76 trials, all 15 GLP-1 receptor agonists lowered HbA1c versus placebo, and tirzepatide lowered it most, by 2.10 percentage points.
- 2025Intermittent fasting strategies and their effects on body weight and other cardiometabolic risk factors: systematic review and network meta-analysis of randomised clinical trials.BMJAcross 99 trials, intermittent fasting, including time-restricted eating, and continuous calorie restriction both reduced weight, with no difference between strategies for HbA1c.
What well-known voices say about HbA1c
Their positions, summarized in our words. Follow each link for the full context.
Peter AttiaPhysician, host of The Drive podcast and author of Outlive
Attia treats HbA1c as an indirect predictor of average glucose that can mislead in either direction because red cell lifespan varies; he says his own result runs higher than his CGM average because of a thalassemia trait. He prefers CGM and an oral glucose tolerance test for judging metabolic health and argues that a lower value within the normal range is still better.
The Drive, AMA #24: Deep dive into blood glucose (June 2021)
Elizabeth SelvinEpidemiologist at the Johns Hopkins Bloomberg School of Public Health and lead author of the ARIC HbA1c studies
Selvin calls A1C one of the most important clinical biomarkers because it varies less than glucose and reflects overall exposure. She rejects the idea that CGM should replace it, since both tools are imperfect and measure different things, and she found Black and White differences in A1C too small to change how results are read.
Roy TaylorProfessor of medicine at Newcastle University and co-lead of the DiRECT trial
Taylor argues that type 2 diabetes is not necessarily lifelong: substantial weight loss removes excess fat from the liver and pancreas, lets them return to normal function and can bring HbA1c below the diabetes threshold without medication.
Newcastle University press release: Type 2 diabetes is not for life (December 2017)
Watch
Talks and explainers worth your time. Nothing loads from YouTube until you press play.
A1C Test for Diabetes, Animation
Alila Medical MediaAlila Medical Media@alilamedicalmediaSubscribers1.6MStartedJanuary 2014CountryUnited StatesVideos406Total views240.2MNew videos, last 30 days2New videos, last year27From YouTube, 2026-10-31Open on YouTube
An animated walk through how glucose binds hemoglobin and why the test reflects months rather than a moment.
Why Is Hemoglobin A1c Important?
Cleveland ClinicCleveland Clinic@clevelandclinicSubscribers761KStartedFebruary 2007CountryUnited StatesVideos6.6KTotal views396.5MNew videos, last 30 days64New videos, last year500+From YouTube, 2026-10-31Open on YouTube
A short clinician explanation of what the number means for diabetes care, from a major academic medical center.
A1C Levels
Khan AcademyKhan Academy@khanacademySubscribers9.5MStartedNovember 2006CountryUnited StatesVideos9.5KTotal views2.3BNew videos, last 30 days62New videos, last year500+From YouTube, 2026-10-31Open on YouTube
A step-by-step whiteboard lesson linking A1c percentages to blood glucose.
Your Diabetes Health Checks: HbA1c | Learning Zone | Diabetes UK
Diabetes UKDiabetes UK@diabetesukSubscribers77.5KStartedSeptember 2008CountryUnited KingdomVideos583Total views15.8MNew videos, last 30 days9New videos, last year55From YouTube, 2026-10-31Open on YouTube
The UK view of the test, useful for readers whose results come in mmol/mol.
Hemoglobin A1C
Association for Diagnostics & Laboratory MedicineAssociation for Diagnostics & Laboratory Medicine@myadlmSubscribers13.5KStartedJune 2010CountryUnited StatesVideos369Total views5.9MNew videos, last 30 days1New videos, last year14From YouTube, 2026-10-31Open on YouTube
The laboratory side of the test, from the professional society for clinical lab scientists.
Protocols that act on HbA1c
- Low-glycemic dietA low-glycemic diet favors carbohydrate foods that raise blood sugar slowly, rated by the glycemic index (GI): 55 or less is low and 70 or more is high.
- Time-restricted eatingTime-restricted eating means eating all of the day's food and caloric drinks within a consistent daily window, usually 6 to 10 hours, and fasting the rest of the day.
- Ketogenic dietA ketogenic diet keeps carbohydrate under about 20 to 50 g a day so the body burns fat and makes ketones, defined in supervised programs as blood BHB of 0.5 to 3.0 mmol/L.
- Mediterranean dietThe Mediterranean diet is an eating pattern built on vegetables, fruit, legumes, whole grains, nuts, fish and olive oil as the main fat, with little red or processed meat, butter or sweets.
Common questions
What does A1c stand for?
A1c is short for hemoglobin A1c, the fraction of adult hemoglobin (hemoglobin A) that carries glucose. It was named for the order in which it separated in early lab methods, and it is also called HbA1c, glycated hemoglobin or glycohemoglobin.
Is A1c the same as blood sugar?
Does A1c increase with age?
Can an A1c test be wrong?
Can A1c be too low?
In people without diabetes, an A1c below 5.0% was linked to higher mortality in the ARIC study, probably because it often reflects conditions such as anemia [33]. In people taking glucose-lowering drugs, pushing A1c very low brings more hypoglycemia, which is why ADA sets goals individually [13] [11].
Can A1c change in a month?
Partly. Because recent weeks weigh most, A1c can move noticeably within a month, and after glucose drops it falls by half of the gap in about 35 days [2]. The full effect of a change takes about 3 months.
What is the difference between A1c and GMI?
Why is A1c not used to diagnose diabetes in pregnancy?
Does A1c test for insulin resistance?
No. A1c reflects average glucose, and insulin resistance can exist for years while glucose stays normal because the pancreas makes more insulin. Fasting insulin and triglycerides are closer markers of insulin resistance.
Sources
- 1.Bunn HF, Haney DN, Kamin S, Gabbay KH, Gallop PM. The biosynthesis of human hemoglobin A1c. Slow glycosylation of hemoglobin in vivo. Journal of Clinical Investigation, 1976. doi:10.1172/JCI108436
- 2.Tahara Y, Shima K. Kinetics of HbA1c, glycated albumin, and fructosamine and analysis of their weight functions against preceding plasma glucose level. Diabetes Care, 1995. doi:10.2337/diacare.18.4.440
- 3.American Diabetes Association Professional Practice Committee for Diabetes. 2. Diagnosis and Classification of Diabetes: Standards of Care in Diabetes-2026. Diabetes Care, 2026. doi:10.2337/dc26-S002
- 4.Stratton IM, Adler AI, Neil HA, et al. Association of glycaemia with macrovascular and microvascular complications of type 2 diabetes (UKPDS 35): prospective observational study. BMJ, 2000. doi:10.1136/bmj.321.7258.405
- 5.Selvin E, Steffes MW, Zhu H, et al. Glycated hemoglobin, diabetes, and cardiovascular risk in nondiabetic adults. New England Journal of Medicine, 2010. doi:10.1056/NEJMoa0908359
- 6.English E, Idris I, Smith G, Dhatariya K, Kilpatrick ES, John WG. The effect of anaemia and abnormalities of erythrocyte indices on HbA1c analysis: a systematic review. Diabetologia, 2015. doi:10.1007/s00125-015-3599-3
- 7.Lacy ME, Wellenius GA, Sumner AE, et al. Association of Sickle Cell Trait With Hemoglobin A1c in African Americans. JAMA, 2017. doi:10.1001/jama.2016.21035
- 8.Nathan DM, Kuenen J, Borg R, Zheng H, Schoenfeld D, Heine RJ; A1c-Derived Average Glucose Study Group. Translating the A1C assay into estimated average glucose values. Diabetes Care, 2008. doi:10.2337/dc08-0545
- 9.Little RR, Rohlfing CL, Wiedmeyer HM, Myers GL, Sacks DB, Goldstein DE. The national glycohemoglobin standardization program: a five-year progress report. Clinical Chemistry, 2001. PubMed 11673367
- 10.Hoelzel W, Weykamp C, Jeppsson JO, et al. IFCC reference system for measurement of hemoglobin A1c in human blood and the national standardization schemes in the United States, Japan, and Sweden: a method-comparison study. Clinical Chemistry, 2004. doi:10.1373/clinchem.2003.024802
- 11.American Diabetes Association Professional Practice Committee for Diabetes. 6. Glycemic Goals, Hypoglycemia, and Hyperglycemic Crises: Standards of Care in Diabetes-2026. Diabetes Care, 2026. doi:10.2337/dc26-S006
- 12.Cohen RM, Franco RS, Khera PK, et al. Red cell life span heterogeneity in hematologically normal people is sufficient to alter HbA1c. Blood, 2008. doi:10.1182/blood-2008-04-154112
- 13.Diabetes Control and Complications Trial Research Group; Nathan DM, Genuth S, et al. The effect of intensive treatment of diabetes on the development and progression of long-term complications in insulin-dependent diabetes mellitus. New England Journal of Medicine, 1993. doi:10.1056/NEJM199309303291401
- 14.UK Prospective Diabetes Study (UKPDS) Group. Intensive blood-glucose control with sulphonylureas or insulin compared with conventional treatment and risk of complications in patients with type 2 diabetes (UKPDS 33). Lancet, 1998. PubMed 9742976
- 15.World Health Organization. Use of glycated haemoglobin (HbA1c) in diagnosis of diabetes mellitus: abbreviated report of a WHO consultation. World Health Organization, 2011. Link
- 16.National Institute for Health and Care Excellence. Type 2 diabetes: prevention in people at high risk (PH38). NICE public health guideline, 2012. Link
- 17.International Expert Committee. International Expert Committee report on the role of the A1C assay in the diagnosis of diabetes. Diabetes Care, 2009. doi:10.2337/dc09-9033
- 18.American Diabetes Association Professional Practice Committee for Diabetes. 15. Management of Diabetes in Pregnancy: Standards of Care in Diabetes-2026. Diabetes Care, 2026. doi:10.2337/dc26-S015
- 19.Galindo RJ, de Boer IH, Neumiller JJ, Tuttle KR. Continuous Glucose Monitoring to Optimize Management of Diabetes in Patients with Advanced CKD. Clinical Journal of the American Society of Nephrology, 2023. doi:10.2215/CJN.04510422
- 20.Cavagnolli G, Pimentel AL, Freitas PA, Gross JL, Camargo JL. Effect of ethnicity on HbA1c levels in individuals without diabetes: Systematic review and meta-analysis. PLoS One, 2017. doi:10.1371/journal.pone.0171315
- 21.Pani LN, Korenda L, Meigs JB, et al. Effect of aging on A1C levels in individuals without diabetes: evidence from the Framingham Offspring Study and the National Health and Nutrition Examination Survey 2001-2004. Diabetes Care, 2008. doi:10.2337/dc08-0577
- 22.Battelino T, Danne T, Bergenstal RM, et al. Clinical Targets for Continuous Glucose Monitoring Data Interpretation: Recommendations From the International Consensus on Time in Range. Diabetes Care, 2019. doi:10.2337/dci19-0028
- 23.Gummesson A, Nyman E, Knutsson M, Karpefors M. Effect of weight reduction on glycated haemoglobin in weight loss trials in patients with type 2 diabetes. Diabetes, Obesity and Metabolism, 2017. doi:10.1111/dom.12971
- 24.Umpierre D, Ribeiro PA, Kramer CK, et al. Physical activity advice only or structured exercise training and association with HbA1c levels in type 2 diabetes: a systematic review and meta-analysis. JAMA, 2011. doi:10.1001/jama.2011.576
- 25.Esposito K, Maiorino MI, Bellastella G, Chiodini P, Panagiotakos D, Giugliano D. A journey into a Mediterranean diet and type 2 diabetes: a systematic review with meta-analyses. BMJ Open, 2015. doi:10.1136/bmjopen-2015-008222
- 26.Sainsbury E, Kizirian NV, Partridge SR, Gill T, Colagiuri S, Gibson AA. Effect of dietary carbohydrate restriction on glycemic control in adults with diabetes: A systematic review and meta-analysis. Diabetes Research and Clinical Practice, 2018. doi:10.1016/j.diabres.2018.02.026
- 27.Reynolds AN, Akerman AP, Mann J. Dietary fibre and whole grains in diabetes management: Systematic review and meta-analyses. PLoS Medicine, 2020. doi:10.1371/journal.pmed.1003053
- 28.Sherifali D, Nerenberg K, Pullenayegum E, Cheng JE, Gerstein HC. The effect of oral antidiabetic agents on A1C levels: a systematic review and meta-analysis. Diabetes Care, 2010. doi:10.2337/dc09-1727
- 29.Yao H, Zhang A, Li D, et al. Comparative effectiveness of GLP-1 receptor agonists on glycaemic control, body weight, and lipid profile for type 2 diabetes: systematic review and network meta-analysis. BMJ, 2024. doi:10.1136/bmj-2023-076410
- 30.Rahbar S. An abnormal hemoglobin in red cells of diabetics. Clinica Chimica Acta, 1968. doi:10.1016/0009-8981(68)90372-0
- 31.Koenig RJ, Peterson CM, Jones RL, Saudek C, Lehrman M, Cerami A. Correlation of glucose regulation and hemoglobin AIc in diabetes mellitus. New England Journal of Medicine, 1976. doi:10.1056/NEJM197608192950804
- 32.American Diabetes Association. Diagnosis and classification of diabetes mellitus. Diabetes Care, 2010. doi:10.2337/dc10-S062
- 33.Aggarwal V, Schneider AL, Selvin E. Low hemoglobin A(1c) in nondiabetic adults: an elevated risk state?. Diabetes Care, 2012. doi:10.2337/dc11-2531
- 34.Shah VN, Vigers T, Pyle L, Calhoun P, Bergenstal RM. Discordance Between Glucose Management Indicator and Glycated Hemoglobin in People Without Diabetes. Diabetes Technology and Therapeutics, 2023. doi:10.1089/dia.2022.0544
- 35.Bergenstal RM, Beck RW, Close KL, et al. Glucose Management Indicator (GMI): A New Term for Estimating A1C From Continuous Glucose Monitoring. Diabetes Care, 2018. doi:10.2337/dc18-1581
- 36.Lee SWH, Ng KY, Chin WK. The impact of sleep amount and sleep quality on glycemic control in type 2 diabetes: A systematic review and meta-analysis. Sleep Medicine Reviews, 2017. doi:10.1016/j.smrv.2016.02.001
- 37.Knowler WC, Barrett-Connor E, Fowler SE, et al. Reduction in the incidence of type 2 diabetes with lifestyle intervention or metformin. New England Journal of Medicine, 2002. doi:10.1056/NEJMoa012512
- 38.Lean ME, Leslie WS, Barnes AC, et al. Primary care-led weight management for remission of type 2 diabetes (DiRECT): an open-label, cluster-randomised trial. Lancet, 2018. doi:10.1016/S0140-6736(17)33102-1
- 39.Semnani-Azad Z, Khan TA, Chiavaroli L, et al. Intermittent fasting strategies and their effects on body weight and other cardiometabolic risk factors: systematic review and network meta-analysis of randomised clinical trials. BMJ, 2025. doi:10.1136/bmj-2024-082007
- 40.Sandforth A, von Schwartzenberg RJ, Arreola EV, et al. Mechanisms of weight loss-induced remission in people with prediabetes: a post-hoc analysis of the randomised, controlled, multicentre Prediabetes Lifestyle Intervention Study (PLIS). Lancet Diabetes and Endocrinology, 2023. doi:10.1016/S2213-8587(23)00235-8