
Low-glycemic diet
What is low-glycemic diet?
A low-glycemic diet favors carbohydrate foods that raise blood sugar slowly, rated by the glycemic index (GI): 55 or less is low and 70 or more is high. In people with diabetes, randomized trials show HbA1c falls by about 0.3 to 0.5 percentage points. Effects on weight loss are small or absent.
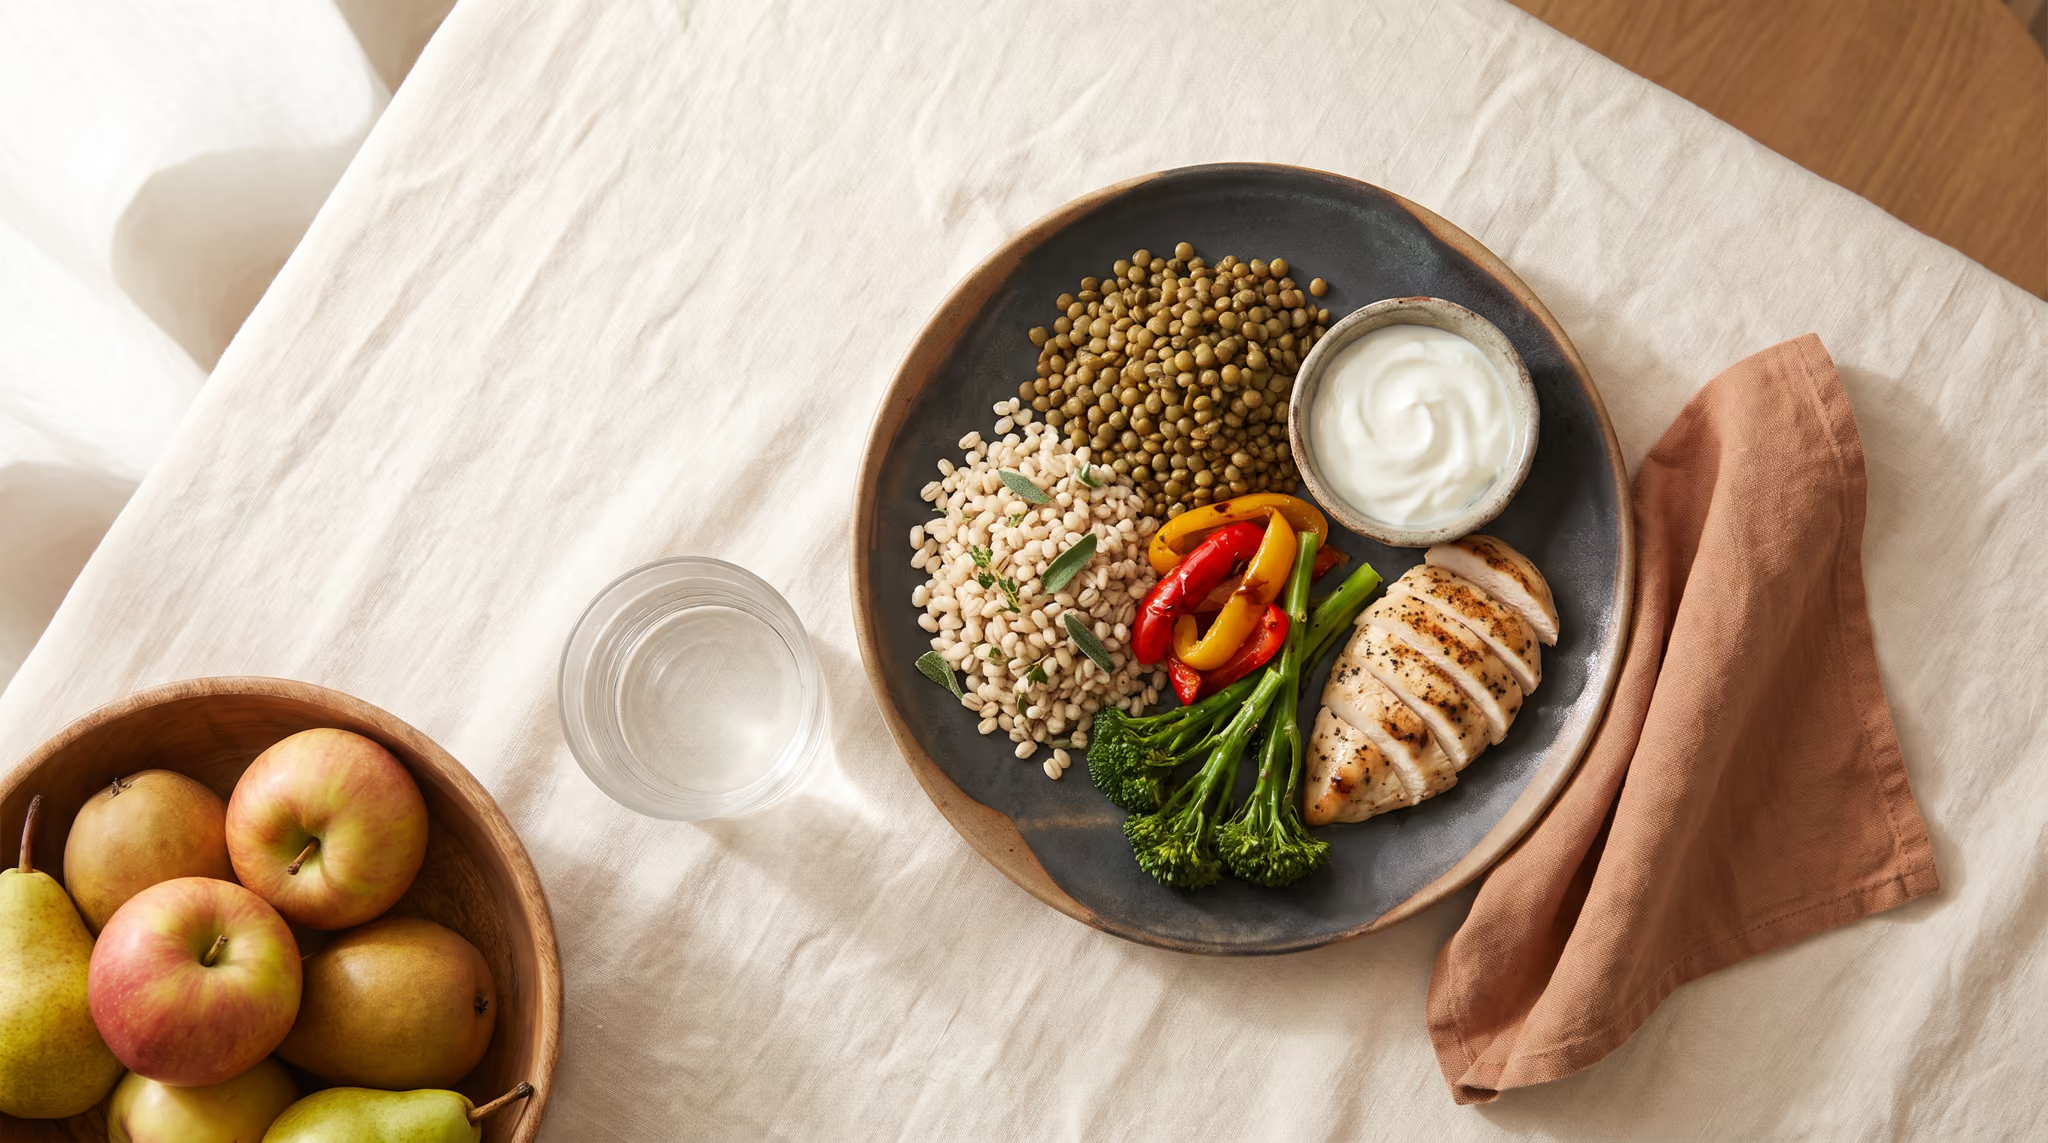
Diabetes UK describes GI as a useful tool, and a 2021 meta-analysis done to inform European diabetes guidelines found a small, high-certainty HbA1c benefit. Beyond diabetes the picture is mixed: a Cochrane review finds little effect on weight, a strict feeding trial found no benefit for heart risk factors, and reviews rate GI as weaker evidence than fiber and whole grains. Glucose-spike programs for healthy people go further than the data.
The rules
The rules ofLow-glycemic diet
- 1Choose carbohydrate foods with a glycemic index of 55 or less for most meals.
- 2Limit foods with a glycemic index of 70 or more, such as white bread, regular potatoes, bagels and sugar-sweetened cereals.
- 3Keep the glycemic load of a typical serving at 10 or less, and watch portion sizes of starchy foods.
- 4Eat legumes, coarse or intact grains, pasta, plain dairy, fruit and non-starchy vegetables as the main carbohydrate sources.
- 5Pair carbohydrate with protein, fat or fiber at each meal: at least 20 g of protein and at most 60 g of carbohydrate per meal.
- 6Get at least 14 g of fiber per 1,000 kcal and at least 90 g of whole grains a day.
- 7Drink no sugar-sweetened drinks and keep added sugar to 5% of energy or less.
Share these rules as an image or a link.
| Classic low GI | Swap high GI carbohydrate foods for low GI alternatives without changing total carbohydrate, as in the Jenkins diabetes trials. |
|---|---|
| Low glycemic load | Lower both GI and carbohydrate portion size, scoring each serving's glycemic load. |
| Diogenes: higher protein, low GI | A modest rise in protein with lower GI carbohydrate, eaten freely, to maintain weight after weight loss. |
| Personalized glucose-targeting | Meals chosen by an algorithm or a continuous glucose monitor to minimize each person's own post-meal glucose rise. |
| Glucose hacks | Popular rules such as eating vegetables first, a vegetable starter, adding protein, fat or fiber to carbohydrate and moving after meals. |
| AumniVIDA glucose stability | Fiber 14 g per 1,000 kcal, whole grains 90 g a day, added sugar at most 5% of energy, 20 g protein and at most 60 g carbohydrate per meal, no sugary drinks, last meal 3 hours before sleep. |
What it aims to do
- Lower HbA1c and fasting glucose in people with diabetes or prediabetes.
- Reduce large rises in blood sugar after meals.
- Lower the risk of developing type 2 diabetes.
- Improve blood lipids and lower cardiovascular risk.
- Help with appetite control and keeping weight off.
What it claims, and what the evidence shows
Grades reflect evidence in people. Animal and cell results alone never earn more than limited.
Blood sugar and insulin
Strong evidenceHeart and blood vessels
Mixed evidenceBody fat and weight
Mixed evidenceInflammation
Limited evidenceLower inflammation
In diabetes trials, low GI diets lowered CRP by 0.41 mg/L; data outside diabetes are sparse. [1]
Skin
Limited evidenceClearer skin in acne
One 12-week trial in 43 young men found fewer acne lesions, but weight loss in the low GL group confounds the result. [11]
Energy and fatigue
Not enough evidence
Key takeaways
- 1
The glycemic index rates carbohydrate foods against glucose: 55 or less is low and 70 or more is high; glycemic load also counts portion size.
- 2
In people with diabetes, low GI diets lower HbA1c by about 0.3 to 0.5 percentage points, with high-certainty evidence in a 2021 BMJ meta-analysis.
- 3
For weight, a 2023 Cochrane review found little or no difference, although low GI may help a little with keeping lost weight off.
- 4
For heart risk, the results are mixed: small lipid drops in diabetes trials and a cohort link, but no benefit in the OmniCarb feeding trial.
- 5
Glucose responses vary between people, but much of the variation is day-to-day noise and monitor error; fiber, whole grains and fewer sugary drinks carry most of the benefit.
What is a low-glycemic diet?
A low-glycemic diet chooses carbohydrate foods that raise blood sugar slowly, rated by the glycemic index (GI) on a 0 to 100 scale against pure glucose. Low GI is 55 or less and high GI is 70 or more. Glycemic load (GL) also counts how much carbohydrate a portion contains.
The glycemic index. In 1981, David Jenkins and colleagues fed 62 common foods to small groups of healthy volunteers and measured blood glucose for 2 hours. They expressed each food's response as a percentage of the response to the same amount of carbohydrate taken as glucose [13]. Dried legumes (31%) and dairy foods (35%) raised blood sugar least. Fat and protein in a food blunted the rise; fiber and sugar content, on their own, did not predict it.
Cutoffs. The University of Sydney's GI group, which keeps the international GI database, classes foods as low GI at 55 or less and high GI at 70 or more. The 2021 international tables list more than 4,000 tested items [14].
Glycemic load. GI compares equal amounts of carbohydrate, not normal portions. Glycemic load fixes that: GI multiplied by the grams of available carbohydrate in a serving, divided by 100. A GL of 10 or less is low, 11 to 19 intermediate and 20 or more high [15]. Watermelon and a doughnut have similar GIs, but a serving of watermelon has a GL of about 8 and a medium doughnut about 17.
What it is not. A low-glycemic diet is not a low-carbohydrate diet. It changes the type of carbohydrate, not necessarily the amount. It is also not a calorie plan: fat lowers a food's glucose response, so some high-fat processed foods score low.
Glycemic index versus glycemic load
GL = GI × grams of available carbohydrate per serving ÷ 100
- GI
- How much a food's carbohydrate raises blood glucose, against glucose at 100. Low is 55 or less, high 70 or more.
- Carbohydrate
- Grams of available carbohydrate in one normal serving
- GL
- Low is 10 or less, intermediate 11 to 19, high 20 or more
Sources: Linus Pauling Institute; University of Sydney GI group.
What foods are low glycemic, and which should you limit?
Legumes, plain dairy, pasta, most fruit, coarse oats, rye bread and non-starchy vegetables are usually low GI. Regular potatoes, white bread, bagels, doughnuts, some sugary cereals, sugary drinks and watermelon are high. Processing and ripeness change GI, so the same food can vary.
The 2021 international tables found that dairy products, legumes, pasta and fruit were usually low GI and gave consistent values worldwide. Breads, breakfast cereals and rice came in high, medium and low GI versions, and whole-meal products were not reliably low, presumably because of how they were made. Most potatoes were high GI, although a few low GI varieties now exist [14].
What changes a food's GI?
- Processing. Cereal products, including whole-grain ones, vary widely in GI, presumably because of how they are made [14].
- Ripeness. Diabetes UK lists overripe bananas as medium GI, while most other whole fruit is low.
- The rest of the meal. Fat and protein lower the glucose response [13], which is why AumniVIDA pairs carbohydrate with protein, fat or fiber rather than removing it.
- Portion size. A low GI food in a large portion can still carry a high glycemic load [15].
AumniVIDA's glucose stability targets
- Fiber at least 14 g per 1,000 kcal and whole grains at least 90 g a day.
- Added sugar at most 5% of energy, and no sugar-sweetened drinks.
- At least 20 g of protein and at most 60 g of carbohydrate per meal, judged across most meals rather than every one.
- Last meal at least 3 hours before sleep.
The app estimates glycemic load from logged meals and labels it as an estimate, because published GI values vary by brand, ripeness and preparation.
| Low GI (55 or less) | Medium GI (56 to 69) | High GI (70 or more) |
|---|---|---|
| Beans, peas, lentils | Couscous, basmati rice, chapatti | White bread and some wholemeal breads |
| Unsweetened milk and yogurt | New potatoes, sweet potato, pumpkin, parsnip | Regular potatoes, baked, boiled, fried or mashed |
| Steel-cut oats, rye bread, pasta | Plain popcorn | Doughnuts, bagels and sweets |
| Apples, pears, oranges, berries, grapes | Pineapple, cantaloupe, overripe bananas | Watermelon |
| Carrots, tomatoes, spinach, broccoli | Broad beans | Some sugar-sweetened cereals and sugary drinks |
Does a low-glycemic diet lower HbA1c and help diabetes?
Yes, modestly. In people with diabetes, low GI diets lower HbA1c by about 0.3 to 0.5 percentage points in meta-analyses of randomized trials, on top of medication. A 2021 BMJ meta-analysis rated the HbA1c evidence as high certainty. For preventing diabetes, the evidence is observational and weaker than for fiber.
In people with diabetes. A meta-analysis of 29 trial comparisons in 1,617 people with type 1 or type 2 diabetes found that low GI or GL diets lowered HbA1c by 0.31 percentage points versus higher GI diets, with high-certainty evidence, plus small drops in fasting glucose [1]. An earlier Cochrane review of 11 trials found a drop of 0.5 points and fewer hypoglycemia episodes in one trial [2]. In the largest single trial, 210 adults with type 2 diabetes lowered HbA1c by 0.50 points on low GI advice versus 0.18 on high cereal fiber advice over 6 months [3]. These are small but clinically meaningful changes; see HbA1c.
For prevention. In 65,173 US women, the highest glycemic load fifth had 47% higher risk of type 2 diabetes, and high glycemic load combined with low cereal fiber more than doubled risk [4]. The Lancet's 2019 series of reviews put this in context: fiber and whole grains were linked to 15 to 30% lower risk of diabetes, heart disease and death, while low GI or GL diets showed smaller or no reductions, with low to very low certainty [5]. Sugar-sweetened drinks are the clearest single target: each daily serving was linked to 13% more diabetes after adjusting for body fat [16].
The practical message is that fiber, whole grains and fewer sugary drinks carry most of the benefit, and GI helps choose between carbohydrate foods.
How much low-GI and personalized diets lowered HbA1c
- Cochrane review, 11 trials-0.5 percentage points of HbA1c versus comparison diet
Thomas 2009, parallel trials
- Low GI vs high cereal fiber, 6 months-0.32 percentage points of HbA1c versus comparison diet
Jenkins 2008, 210 adults with type 2 diabetes
- BMJ meta-analysis, 29 comparisons-0.31 percentage points of HbA1c versus comparison diet
Chiavaroli 2021, high certainty
- Personalized vs Mediterranean, prediabetes-0.08 percentage points of HbA1c versus comparison diet
Ben-Yacov 2021, 225 adults
Show the data
| Item | Value (percentage points of HbA1c versus comparison diet) | Low | High | Note |
|---|---|---|---|---|
| Cochrane review, 11 trials | -0.5 | -0.9 | -0.1 | Thomas 2009, parallel trials |
| Low GI vs high cereal fiber, 6 months | -0.32 | Jenkins 2008, 210 adults with type 2 diabetes | ||
| BMJ meta-analysis, 29 comparisons | -0.31 | -0.42 | -0.19 | Chiavaroli 2021, high certainty |
| Personalized vs Mediterranean, prediabetes | -0.08 | -0.14 | -0.02 | Ben-Yacov 2021, 225 adults |
Does a low-glycemic diet help you lose weight?
Not much on its own. A 2023 Cochrane review found low GI diets probably make little or no difference to weight loss compared with higher GI diets. They may help a little with keeping weight off: in the Diogenes trial, low GI groups regained 0.95 kg less over 26 weeks.
Losing weight. The 2023 Cochrane review included 10 trials in 1,210 people. Compared with higher GI diets, low GI or GL diets changed weight by 0.82 kg, with a confidence interval that crossed zero, which the reviewers judged as probably little or no difference [8]. All trials had unclear or high risk of bias, and none reported on mortality.
Keeping weight off. The European Diogenes trial first had 773 adults lose an average 11.0 kg on an 800 kcal diet, then assigned them to one of five maintenance diets for 26 weeks. Low GI groups regained 0.95 kg less than high GI groups, and high protein groups 0.93 kg less than low protein groups. Fewer people dropped out of the low GI and high protein arms [9]. That points toward a combination of more protein and lower GI, which overlaps with the high-protein diet.
In diabetes. Low GI diets lowered body weight by 0.66 kg on average [1].
The mechanism people cite. High GI meals cause faster rises and falls in glucose and insulin, which some researchers argue drive hunger and fat storage [17]. In rats kept at the same body weight, high GI starch produced 71% more body fat [10]. Human trials have not shown an effect of that size.
Does a low-glycemic diet lower cardiovascular risk?
The evidence is mixed. In diabetes trials, low GI diets lowered LDL cholesterol by about 7 mg/dL (0.17 mmol/L)0.17 mmol/L (about 7 mg/dL) and triglycerides slightly. A large cohort linked high GI diets to 21% more cardiovascular events. But a tightly controlled feeding trial, OmniCarb, found no benefit for lipids, blood pressure or insulin sensitivity.
Risk factors in diabetes. The 2021 BMJ meta-analysis found reductions in LDL cholesterol (0.17 mmol/L), non-HDL cholesterol (0.20 mmol/L), ApoB (0.05 g/L) and triglycerides (0.09 mmol/L), with no change in HDL cholesterol or diastolic blood pressure [1]. See LDL cholesterol, ApoB and triglycerides.
Events. In the PURE cohort of 137,851 adults on five continents, the highest GI diets were linked to more major cardiovascular events or death than the lowest: HR 1.51 in people with heart disease and 1.21 in people without it [6]. For glycemic load, the link was not significant in people without heart disease.
The counterweight. OmniCarb fed 163 adults four complete DASH-style diets for 5 weeks each. On a high carbohydrate diet, lowering GI from 65 to 40 reduced insulin sensitivity by 20% and raised LDL cholesterol from 139 to 147 mg/dL; it did not change HDL, triglycerides or blood pressure [7]. The authors concluded that within an already healthy diet, choosing foods by GI may not improve cardiovascular risk factors. Lowering total carbohydrate did lower triglycerides.
Why the results differ. OmniCarb tested GI alone in an already healthy diet; the cohorts and many diabetes trials changed whole patterns, adding legumes, intact grains and fiber. The Lancet reviews found that fiber and whole grains, more than GI itself, carried the clearest benefit [5].
Blood glucose and lipid changes on low-GI diets in diabetes
- Fasting glucose-6 mg/dL versus control diet-0.36 mmol/L versus control diet
- Non-HDL cholesterol-4 mg/dL versus control diet-0.2 mmol/L versus control diet
- LDL cholesterol-3 mg/dL versus control diet-0.17 mmol/L versus control diet
- Triglycerides-2 mg/dL versus control diet-0.09 mmol/L versus control diet
Show the data
| Item | Value (mmol/L versus control diet) | Low | High | Note |
|---|---|---|---|---|
| Fasting glucose | -0.36 | |||
| Non-HDL cholesterol | -0.2 | -0.33 | -0.07 | |
| LDL cholesterol | -0.17 | -0.25 | -0.08 | |
| Triglycerides | -0.09 | -0.17 | -0.01 |
Do people respond differently to the same food? What continuous glucose monitors show
Yes, glucose responses to identical meals vary widely between people, as the 2015 Weizmann study of 800 people showed. But later work found much of that variation is day-to-day noise in the same person, consumer monitors overestimate glucose in healthy people, and personalized diets beat a Mediterranean diet by only 0.08 HbA1c points.
The personalized nutrition finding. Researchers at the Weizmann Institute tracked 46,898 meals in 800 adults with continuous glucose monitors and found large differences between people eating identical meals. An algorithm using blood tests, habits, body measures and gut microbiome predicted individual responses, and diets built from it lowered post-meal glucose in a small blinded trial [18]. In the UK PREDICT 1 study of 1,002 adults, glucose responses to identical meals varied with a coefficient of variation of 68% [19]. Even people with normal standard tests spent 15% of the day in the prediabetic range on a monitor [20].
Does personalization improve outcomes? In 225 adults with prediabetes, an algorithm-personalized diet cut time above 140 mg/dL (7.8 mmol/L)7.8 mmol/L (140 mg/dL) by 1.3 hours a day versus 0.3 hours on a Mediterranean diet, and HbA1c by 0.16 versus 0.08 percentage points over 6 months [21]. The difference was statistically significant and small.
The limits.
- Noise within a person. When the same white bread was tested three times, GI values were 78, 60 and 75, and variation within each person (42.8%) exceeded variation between people (17.8%) [22]. A 2026 reanalysis of 382 adults found that about 90% of individual responses were predicted by each person's response to glucose scaled by the food's GI, within normal day-to-day variation [23].
- Meal composition still matters most for glucose. In PREDICT 1, a meal's macronutrients explained more glucose variation (15.4%) than the gut microbiome (6.0%) [19].
- Device error. In 15 healthy adults, a continuous glucose monitor read about 0.9 mmol/L higher than finger-prick samples and overestimated time above 7.8 mmol/L about fourfold [12].
- Stable traits. Repeated n-of-1 tests in 176 young adults did find a personal glycemic sensitivity that stayed stable over 2 years [24], so some people really do run higher.
A monitor can show which meals raise your glucose, but a single spike is not a diagnosis, and HbA1c and fasting glucose remain the outcomes that matter.
How is a low-glycemic diet different from low-carb and keto?
A low-glycemic diet changes the kind of carbohydrate; low-carb and keto diets cut the amount. A low GI diet can keep carbohydrate at usual levels, while a ketogenic diet keeps it under about 20 to 50 g a day. Lowering carbohydrate lowers triglycerides more; lowering GI alone did little in OmniCarb.
In OmniCarb, the most informative contrast was the low GI, low carbohydrate diet (40% of energy from carbohydrate) against the high GI, high carbohydrate diet (58%). It lowered triglycerides from 111 to 86 mg/dL (23%) but did not change insulin sensitivity, LDL cholesterol, HDL cholesterol or blood pressure [7]. Within the low carbohydrate diets, switching to low GI lowered triglycerides by only 5%.
- The ketogenic diet removes most starchy foods, fruit and legumes, which makes GI largely irrelevant and lowers glucose spikes by removing carbohydrate.
- The Mediterranean diet is naturally low to moderate GI because it relies on legumes, vegetables, fruit and pasta, and it served as the comparison diet in the personalized nutrition trial [21].
- The anti-inflammatory diet shares the emphasis on whole grains, legumes and plant variety.
| Question | Low-glycemic | Low-carb | Ketogenic |
|---|---|---|---|
| What changes | Type of carbohydrate | Amount of carbohydrate | Amount, to induce ketosis |
| Typical carbohydrate | Usual amounts (58% of energy in OmniCarb's high carbohydrate diets) | Reduced (40% of energy in OmniCarb's low carbohydrate diets) | About 20 to 50 g a day |
| Legumes and fruit | Encouraged | Limited | Mostly excluded |
| Whole grains | Encouraged, especially intact grains | Limited | Excluded |
| Main evidence | HbA1c in diabetes trials | Weight and triglyceride trials | Weight, seizures and triglyceride trials |
Changing carbohydrate type versus amount
Carbohydrate quality down, Carbohydrate amount across
Intact, high fiber, low GI
- Very low: about 20 to 50 g a dayKetogenic diet: GI largely irrelevant
- Reduced: 40% of energyLow-carb diets; OmniCarb low GI, low carbohydrate diet
- Usual: 58% of energyLow-glycemic diet; Mediterranean diet
Refined, high GI
- Very low: about 20 to 50 g a dayKetogenic diet: GI largely irrelevant
- Reduced: 40% of energyLow-carb diets: quality varies
- Usual: 58% of energyOmniCarb high GI, high carbohydrate diet
| Very low: about 20 to 50 g a day | Reduced: 40% of energy | Usual: 58% of energy | |
|---|---|---|---|
| Intact, high fiber, low GI | Ketogenic diet: GI largely irrelevant | Low-carb diets; OmniCarb low GI, low carbohydrate diet | Low-glycemic diet; Mediterranean diet |
| Refined, high GI | Ketogenic diet: GI largely irrelevant | Low-carb diets: quality varies | OmniCarb high GI, high carbohydrate diet |
In OmniCarb, cutting carbohydrate from 58% to 40% of energy with low GI foods lowered triglycerides 23% but did not change insulin sensitivity or LDL cholesterol; lowering GI alone did little.
Does a low-glycemic diet help acne, PCOS, energy or cravings? Claims beyond the evidence
One 12-week trial in 43 young men found fewer acne lesions on a low glycemic load diet, but they also lost weight. Claims about steadier energy, fewer cravings and less brain fog from flattening glucose spikes have little trial evidence in people without diabetes.
Acne. Young men on a low glycemic load diet had 23.5 fewer acne lesions after 12 weeks versus 12.0 fewer on a control diet. They also lost 2.9 kg, so the authors could not separate diet from weight loss [11]. The trial included only males aged 15 to 25.
PCOS and fertility. Low GI diets are often recommended for polycystic ovary syndrome because insulin resistance is common in it. We did not find trials strong enough to grade here, so this page leaves PCOS ungraded.
Energy, mood and cravings. Popular glucose programs promise better energy, fewer cravings and less inflammation by flattening glucose spikes. The 2023 Cochrane review found one small trial on mood, with very uncertain results [8]. Critics such as the diabetes dietitian Nicola Guess argue that consumer monitor readings mislead healthy people, and device studies support caution [12].
Animal results. In rodents, high GI starch caused more body fat and damaged insulin-producing cells at equal body weight [10]. These experiments support the mechanism [17] but cannot grade an effect in people.
The studies, by type
Strongest designs first. Scroll each row; every card links to the paper and says whether it supports the protocol.
Systematic reviews and meta-analyses (5)
Randomized controlled trials (5)
Large observational studies in people (2)
Mechanistic studies in people (8)
Animal and cell studies (1)
Case reports and N-of-1 experiments (1)
Hypotheses and expert reviews (2)
Who follows it, who backs it, who doubts it
Public positions summarized in our words. Follow each link for the full context.
Follow it
Jessie InchauspéAuthor and founder of Glucose Goddess
Promotes ten glucose hacks, such as eating vegetables first, a vegetable starter, adding protein, fat or fiber to carbohydrates and moving after meals, for people with and without diabetes; she also sells an anti-spike supplement.
Support it
Jennie Brand-MillerProfessor of human nutrition, University of Sydney; head of the University's GI group
Leads the group that maintains the international GI database and presents low GI carbohydrate as a key to long-term health, lower diabetes and heart disease risk and maintaining weight loss.
David JenkinsNutrition scientist, University of Toronto and St. Michael's Hospital; co-creator of the glycemic index
Led the PURE analysis that linked high GI diets to more cardiovascular events and deaths across five continents, after introducing the glycemic index in 1981.
David LudwigObesity and nutrition researcher; author of a 2002 JAMA review of the glycemic index
Argues that the hormonal responses to high GI foods can promote fat gain and diabetes, citing animal experiments in which high GI starch caused more body fat at the same body weight.
Mixed or cautious
Eran SegalComputational biologist, Weizmann Institute of Science
His team found that glucose responses to identical meals differ so much between people that universal diet rankings may have limited use, and argues for diets personalized by algorithm instead.
Oppose or doubt it
Frank SacksCardiovascular nutrition researcher, Harvard School of Public Health and Brigham and Women's Hospital
Led the OmniCarb feeding trial and concluded that, within an overall healthy diet, choosing foods by glycemic index may not improve heart risk factors or insulin resistance.
Nicola GuessAcademic dietitian and diabetes researcher, University of Oxford
Warns that continuous glucose monitors overestimate glucose in healthy people and can wrongly suggest prediabetes, and advises people without diabetes to read their data with a pinch of salt.
Public examples
- University of Sydney Glycemic Index database
The official GI site and searchable database, with the 55 and 70 cutoffs and the GI Symbol program for tested foods.
- Diabetes UK: Glycaemic index and diabetes
A practical UK guide listing low, medium and high GI foods and simple swaps such as basmati or brown rice and new potatoes with skin.
- Glucose Goddess hacks
A popular commercial program of ten meal rules aimed at flattening glucose curves, including food order and vegetable starters.
How to follow it
- Replace white bread and sugary cereals with rye bread, steel-cut oats, barley, quinoa or bulgur wheat.
- Add legumes such as lentils, chickpeas or beans to at least one meal a day.
- Choose pasta, basmati or brown rice, or new potatoes with skin over regular baked or mashed potatoes.
- Build each meal around at least 20 g of protein and keep starchy carbohydrate to a moderate portion, about 60 g of carbohydrate or less.
- Add vegetables, fat or protein to every carbohydrate food rather than eating it alone.
- Swap sugar-sweetened drinks and juice for water, milk, tea or coffee.
- Eat whole fruit instead of dried fruit or juice for most servings.
- Finish your last meal at least 3 hours before sleep.
How to know you are following it
Track the share of carbohydrate servings that come from low GI foods, fiber per 1,000 kcal, sugary drinks per week and carbohydrate per meal. AumniVIDA scores fiber, whole grains, added sugar, protein and carbohydrate per meal from logged meals across most meals, and estimates glycemic load as a labelled estimate. The outcomes that matter are HbA1c and fasting glucose trends over 3 months or more; a continuous glucose monitor can show meal responses but overestimates glucose in people without diabetes.
Common mistakes
- Choosing high-fat processed snacks just because fat lowers their GI.
- Ignoring portion size: a large portion of a low GI food can carry a high glycemic load.
- Treating every glucose spike on a monitor as harmful, or changing diet based on a few readings.
- Assuming whole-meal bread or cereal is low GI; many are not.
- Cutting fruit, legumes or whole grains to avoid any rise in glucose, which loses fiber.
- Changing glucose-lowering medication without your clinician when readings improve.
Who should be careful
Check with a clinician first if you
- You take insulin or sulfonylureas: better glucose control can raise hypoglycemia risk, so ask your clinician how to adjust doses.
- You have type 1 diabetes: GI changes affect insulin dosing; plan changes with your diabetes team.
- You have kidney disease with a potassium or phosphorus limit: check legume, dairy and fruit portions with a dietitian.
- You have a history of eating disorders: strict food rating and glucose tracking can feed restriction; get support first.
- You are pregnant or have gestational diabetes: follow the plan from your care team.
Possible side effects
- Gas and bloating when legumes and fiber increase quickly; build up over a few weeks.
- Food anxiety or overly restrictive eating from chasing flat glucose curves.
- Hypoglycemia in people on insulin or sulfonylureas if doses are not adjusted.
- Weight gain if low GI foods high in fat replace lower calorie foods.
Follow it in AumniVIDA
Steady your blood sugar with fiber and protein at every meal, at most 60 g of carbohydrate per meal, no sugary drinks and an early last meal, then follow HbA1c and fasting glucose over time.
The targets
AumniVIDA scores these from your logged meals and measurements, and shows the evidence grade for each protocol.
Targets
- Fiber: at least 14 g/1000 kcal
- Whole grains: at least 90 g/day
- Added sugar: at most 5 % of energy
- At least 20 g protein per meal
- At most 60 g carbohydrate per meal
Limits
- No sugar-sweetened drinks
Timing
- Last meal: at least 3 h before sleep
How AumniVIDA follows it with your data
- Score most meals, not every meal. The per-meal targets (at least 20 g of protein, at most 60 g of carbohydrate) are judged over most of your meals.
- Get pairing suggestions. The coach suggests pairing carbohydrate with protein, fat or fiber instead of removing it.
- Follow your outcomes. HbA1c and fasting glucose trends are the result that matters. Ask to see what you ate before a lab result.
- Glycemic estimates are labelled. AumniVIDA estimates glycemic load and labels it as an estimate.
Follow up to five protocols on the free plan, or the full library with Pro. Rank them, and when two protocols disagree, the higher-ranked one guides the app.
Watch
Talks and explainers worth your time. Nothing loads from YouTube until you press play.
What's So Special about Low Glycemic Eating? - Dr. David Jenkins, Dr. David Ludwig
OldwaysOldways@oldwaysSubscribers6.1KStartedApril 2009CountryUnited StatesVideos382Total views1.2MNew videos, last 30 days2New videos, last year22From YouTube, 2026-10-31Open on YouTube
The co-creator of the glycemic index and a leading low GI researcher explain the case for it.
The Glycemic Index, Explained
NourishableNourishable@nourishableSubscribers36.2KStartedFebruary 2015CountryUnited StatesVideos268Total views4.2MNew videos, last 30 days0New videos, last year12From YouTube, 2026-10-31Open on YouTube
A five-minute plain-language explainer of the glycemic index.
Personalized Nutrition by Prediction of Glycemic Responses
Personalized Nutrition ProjectPersonalized Nutrition Project@personalizednutritionproje7792Subscribers364StartedNovember 2013CountryNot statedVideos2Total views65.2KNew videos, last 30 days0New videos, last year0From YouTube, 2026-10-31Open on YouTube
The Weizmann team's own summary of the 2015 personalized glucose study.
What is the best diet for humans? | Eran Segal | TEDxRuppin
TEDx TalksTEDx Talks@tedxSubscribers44.7MStartedJune 2009CountryUnited StatesVideos273.1KTotal views9.2BNew videos, last 30 days500New videos, last year500+From YouTube, 2026-10-31Open on YouTube
Eran Segal argues for personalized rather than universal diet advice.
Sugar SPIKE: The Continuous Glucose Monitor Controversy
Nick Norwitz MD PhDNick Norwitz MD PhD@nicknorwitzmdphdSubscribers1.3MStartedOctober 2013CountryUnited StatesVideos578Total views107.1MNew videos, last 30 days15New videos, last year228From YouTube, 2026-10-31Open on YouTube
A physician-scientist looks at the debate over glucose spikes and monitors in healthy people.
Biomarkers it can move
- HbA1cHbA1c (A1c) is the percentage of hemoglobin in red blood cells that has glucose attached.
- Fasting insulinFasting insulin is the level of insulin in your blood after at least 8 hours without food.
- TriglyceridesTriglycerides are the main form of fat in the body and in the blood, carried by VLDL from the liver and chylomicrons from the gut.
- LDL cholesterolLDL cholesterol (LDL-C) is the cholesterol carried inside low-density lipoprotein particles, the main particles that deliver cholesterol to tissues and lodge in artery walls.
- ApoBApoB (apolipoprotein B) is the protein on every LDL, VLDL, IDL and Lp(a) particle, one per particle, so a blood ApoB test counts the particles that drive atherosclerosis.
- hs-CRPhs-CRP is a blood test that measures C-reactive protein, an inflammation protein made by the liver, at very low levels.
Common questions
What does a low glycemic diet look like?
Meals built around legumes, intact whole grains, pasta, dairy, fruit and vegetables, with protein at each meal and few sugary drinks, white bread or regular potatoes. Low GI foods score 55 or less on the 0 to 100 glucose scale [14].
What foods should you avoid on a low glycemic diet?
Limit high GI foods: regular potatoes, white bread, bagels, doughnuts, sweets, some sugary cereals and sugar-sweetened drinks. Each daily serving of sugary drinks is linked to 13% more type 2 diabetes after adjusting for body fat [16].
Is a low glycemic diet good for diabetics?
Is a low glycemic diet good for weight loss?
What is the difference between glycemic index and glycemic load?
GI compares foods at an equal amount of carbohydrate. Glycemic load multiplies GI by the carbohydrate in a real serving and divides by 100; 10 or less is low and 20 or more is high [15].
Is a low glycemic diet the same as low carb or keto?
No. Low GI changes the type of carbohydrate, low carb and keto cut the amount. In OmniCarb, lowering carbohydrate lowered triglycerides 23%, while lowering GI alone did little [7]. See the ketogenic diet guide.
Does a low glycemic diet help acne?
Possibly. One 12-week trial in 43 young men found fewer acne lesions on a low glycemic load diet, but that group also lost weight [11]. The trial included only young men.
Do I need a continuous glucose monitor to eat low glycemic?
Is a low glycemic diet good for insulin resistance and PCOS?
Sources
- 1.Chiavaroli L, Lee D, Ahmed A, et al. Effect of low glycaemic index or load dietary patterns on glycaemic control and cardiometabolic risk factors in diabetes: systematic review and meta-analysis of randomised controlled trials. BMJ, 2021. doi:10.1136/bmj.n1651
- 2.Thomas D, Elliott EJ. Low glycaemic index, or low glycaemic load, diets for diabetes mellitus. Cochrane Database Syst Rev, 2009. doi:10.1002/14651858.CD006296.pub2
- 3.Jenkins DJ, Kendall CW, McKeown-Eyssen G, et al. Effect of a low-glycemic index or a high-cereal fiber diet on type 2 diabetes: a randomized trial. JAMA, 2008. doi:10.1001/jama.2008.808
- 4.Salmerón J, Manson JE, Stampfer MJ, Colditz GA, Wing AL, Willett WC. Dietary fiber, glycemic load, and risk of non-insulin-dependent diabetes mellitus in women. JAMA, 1997. doi:10.1001/jama.1997.03540300040031
- 5.Reynolds A, Mann J, Cummings J, Winter N, Mete E, Te Morenga L. Carbohydrate quality and human health: a series of systematic reviews and meta-analyses. Lancet, 2019. doi:10.1016/S0140-6736(18)31809-9
- 6.Jenkins DJA, Dehghan M, Mente A, et al. Glycemic Index, Glycemic Load, and Cardiovascular Disease and Mortality. N Engl J Med, 2021. doi:10.1056/NEJMoa2007123
- 7.Sacks FM, Carey VJ, Anderson CA, et al. Effects of high vs low glycemic index of dietary carbohydrate on cardiovascular disease risk factors and insulin sensitivity: the OmniCarb randomized clinical trial. JAMA, 2014. doi:10.1001/jama.2014.16658
- 8.Chekima K, Yan SW, Lee SWH, et al. Low glycaemic index or low glycaemic load diets for people with overweight or obesity. Cochrane Database Syst Rev, 2023. doi:10.1002/14651858.CD005105.pub3
- 9.Larsen TM, Dalskov SM, van Baak M, et al. Diets with high or low protein content and glycemic index for weight-loss maintenance. N Engl J Med, 2010. doi:10.1056/NEJMoa1007137
- 10.Pawlak DB, Kushner JA, Ludwig DS. Effects of dietary glycaemic index on adiposity, glucose homoeostasis, and plasma lipids in animals. Lancet, 2004. doi:10.1016/S0140-6736(04)16937-7
- 11.Smith RN, Mann NJ, Braue A, Mäkeläinen H, Varigos GA. A low-glycemic-load diet improves symptoms in acne vulgaris patients: a randomized controlled trial. Am J Clin Nutr, 2007. doi:10.1093/ajcn/86.1.107
- 12.Hutchins KM, Betts JA, Thompson D, Hengist A, Gonzalez JT. Continuous glucose monitor overestimates glycemia, with the magnitude of bias varying by postprandial test and individual - a randomized crossover trial. Am J Clin Nutr, 2025. doi:10.1016/j.ajcnut.2025.02.024
- 13.Jenkins DJ, Wolever TM, Taylor RH, et al. Glycemic index of foods: a physiological basis for carbohydrate exchange. Am J Clin Nutr, 1981. doi:10.1093/ajcn/34.3.362
- 14.Atkinson FS, Brand-Miller JC, Foster-Powell K, Buyken AE, Goletzke J. International tables of glycemic index and glycemic load values 2021: a systematic review. Am J Clin Nutr, 2021. doi:10.1093/ajcn/nqab233
- 15.Linus Pauling Institute Micronutrient Information Center. Glycemic Index and Glycemic Load. Oregon State University, 2016. Link
- 16.Imamura F, O'Connor L, Ye Z, et al. Consumption of sugar sweetened beverages, artificially sweetened beverages, and fruit juice and incidence of type 2 diabetes: systematic review, meta-analysis, and estimation of population attributable fraction. BMJ, 2015. doi:10.1136/bmj.h3576
- 17.Ludwig DS. The glycemic index: physiological mechanisms relating to obesity, diabetes, and cardiovascular disease. JAMA, 2002. doi:10.1001/jama.287.18.2414
- 18.Zeevi D, Korem T, Zmora N, et al. Personalized Nutrition by Prediction of Glycemic Responses. Cell, 2015. doi:10.1016/j.cell.2015.11.001
- 19.Berry SE, Valdes AM, Drew DA, et al. Human postprandial responses to food and potential for precision nutrition. Nat Med, 2020. doi:10.1038/s41591-020-0934-0
- 20.Hall H, Perelman D, Breschi A, et al. Glucotypes reveal new patterns of glucose dysregulation. PLoS Biol, 2018. doi:10.1371/journal.pbio.2005143
- 21.Ben-Yacov O, Godneva A, Rein M, et al. Personalized Postprandial Glucose Response-Targeting Diet Versus Mediterranean Diet for Glycemic Control in Prediabetes. Diabetes Care, 2021. doi:10.2337/dc21-0162
- 22.Vega-López S, Ausman LM, Griffith JL, Lichtenstein AH. Interindividual variability and intra-individual reproducibility of glycemic index values for commercial white bread. Diabetes Care, 2007. doi:10.2337/dc06-1598
- 23.Della Corte KA, Brand-Miller J, Wolever TM, Della Corte D. Individual glycemic responses scale predictably with the glycemic index: evidence against person-specific food effects. Am J Clin Nutr, 2026. doi:10.1016/j.ajcnut.2026.101363
- 24.Zhang K, Fu Y, Gou W, et al. Quantification of personalized glycemic sensitivity to food and its potential for precision nutrition in a series of n-of-1 trials. Am J Clin Nutr, 2025. doi:10.1016/j.ajcnut.2025.04.015
AumniVIDA explains health information for general wellness. Talk to your clinician before changing your diet, training or medication for a health condition.